Fig. 6
Download original image
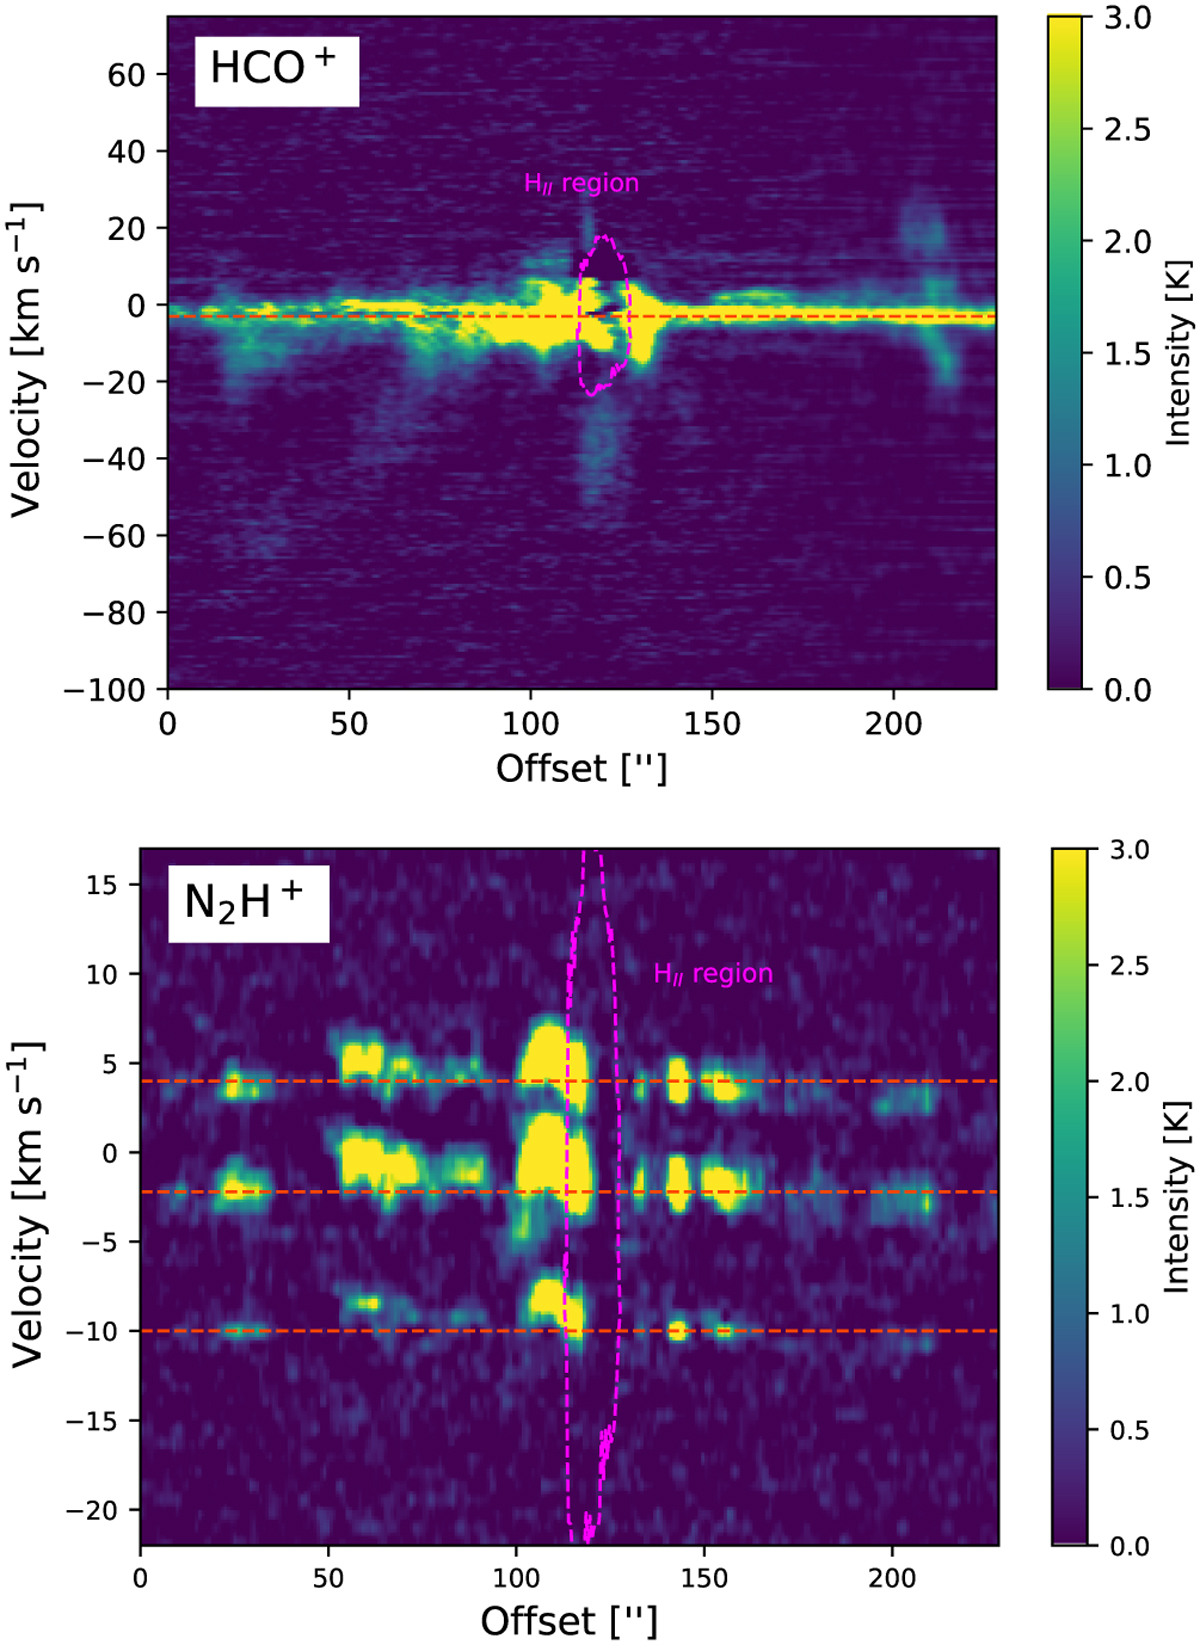
Position–velocity diagrams for HCO+ (top) and N2H+ (bottom) emission along the DR21 ridge. The offset is measured from south to north (see Fig. 4 for the exact location of the cut). The magenta dashed contour marks the H41 α emission from the Η II region while the orange dashed lines mark the source velocity (−3 km s−1). For the N2H+ line, the velocities of the three resolved hyperfine structure components are marked at 4, −3, and −10 km s−1, respectively.
Current usage metrics show cumulative count of Article Views (full-text article views including HTML views, PDF and ePub downloads, according to the available data) and Abstracts Views on Vision4Press platform.
Data correspond to usage on the plateform after 2015. The current usage metrics is available 48-96 hours after online publication and is updated daily on week days.
Initial download of the metrics may take a while.