Fig. 11
Download original image
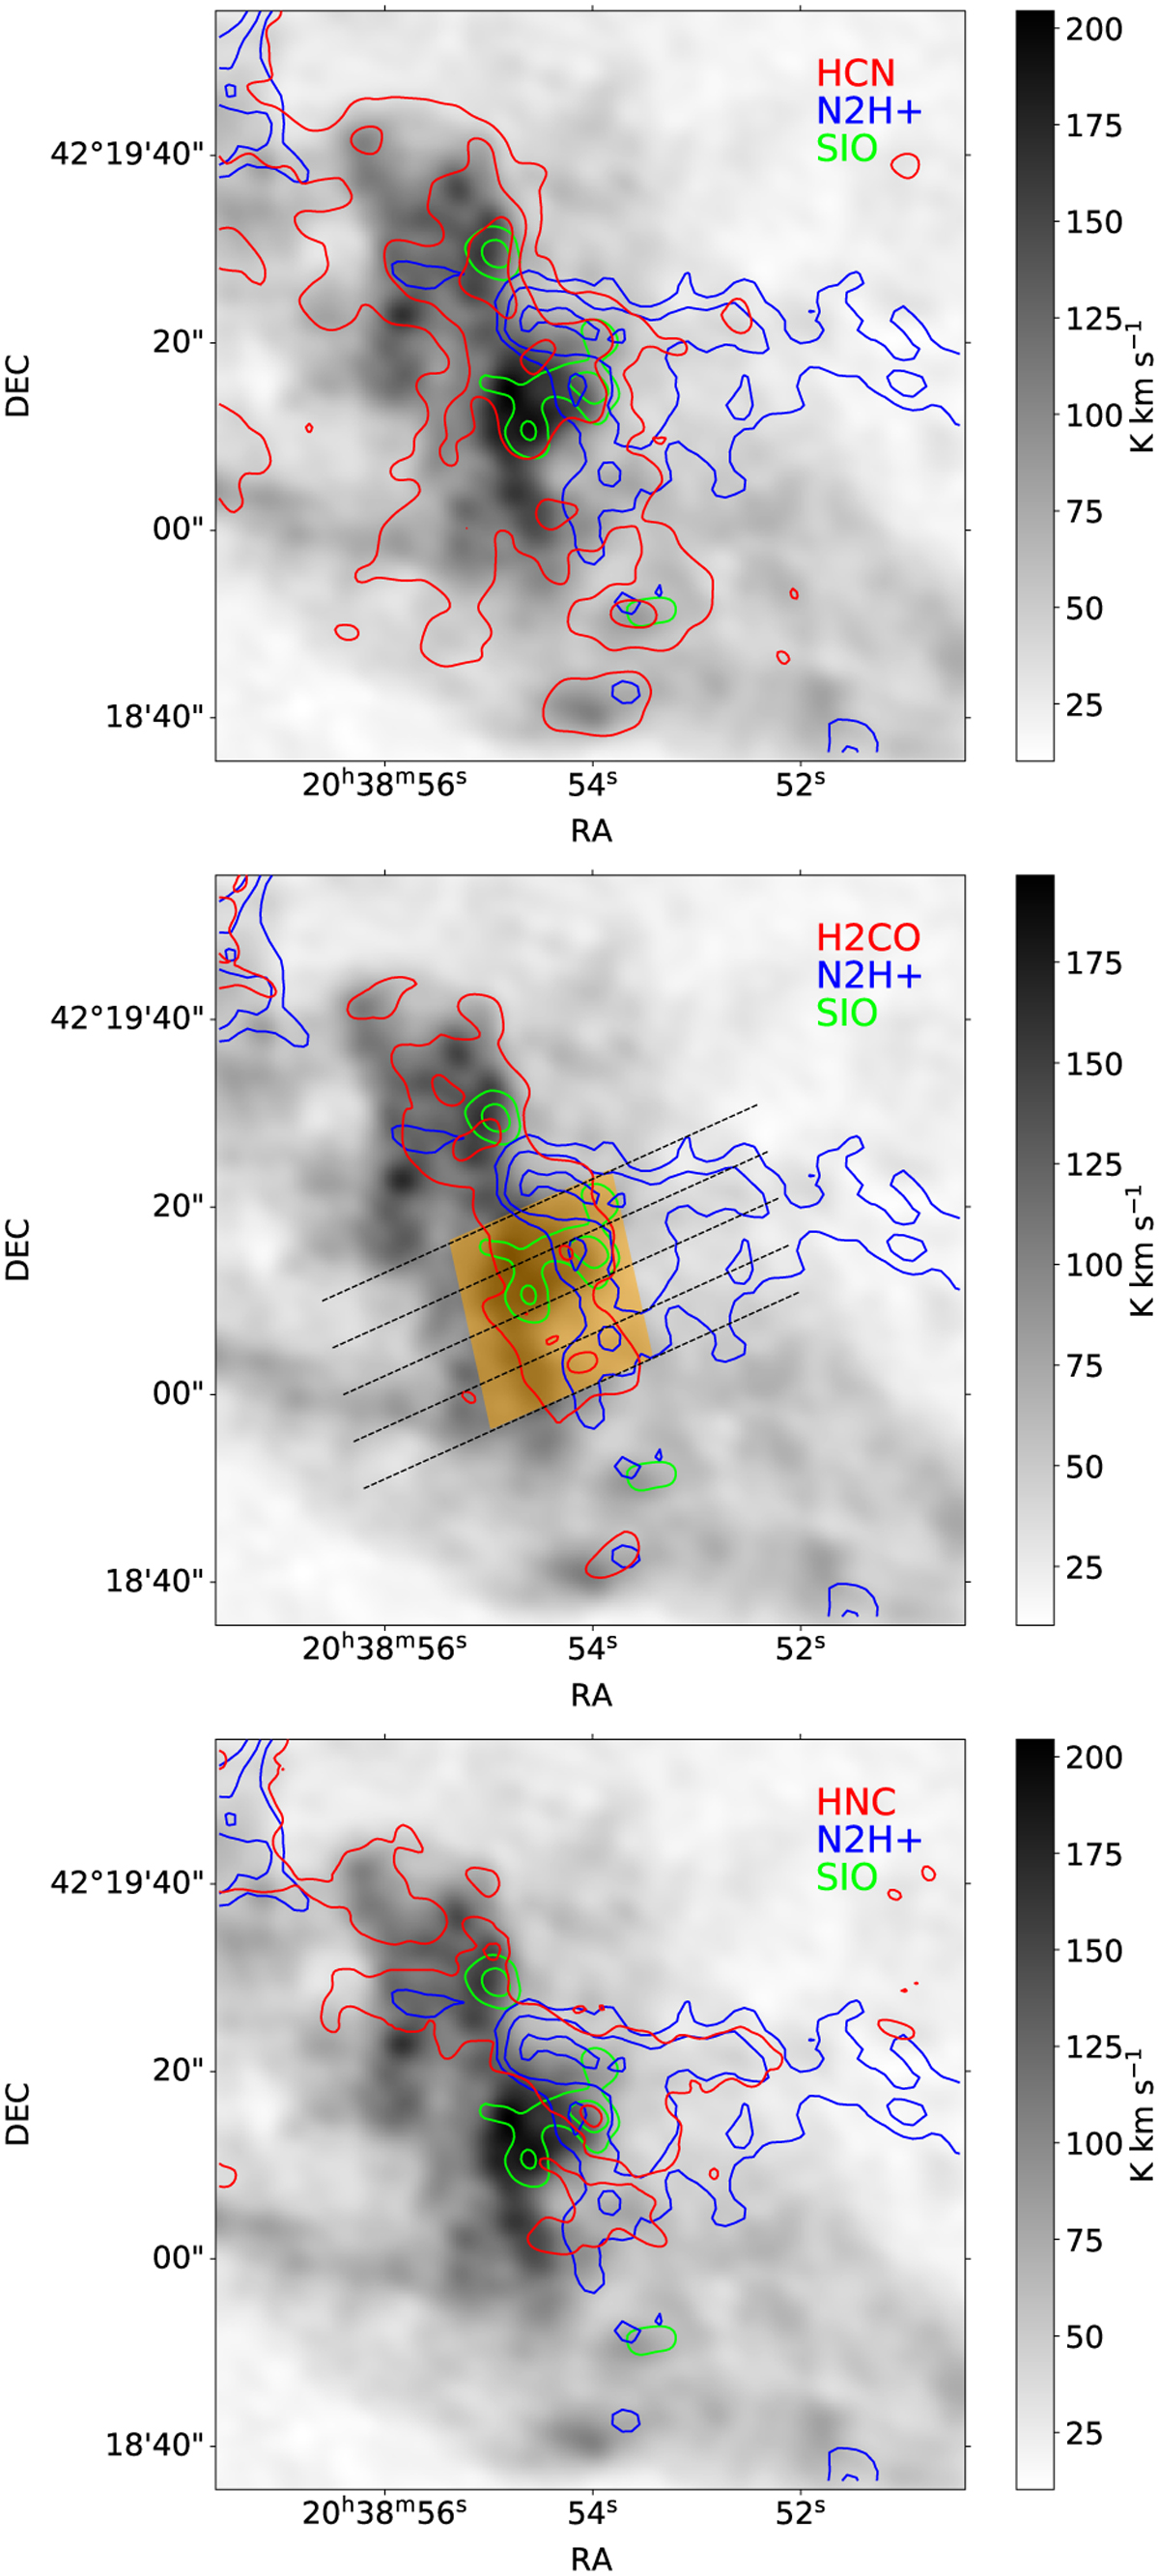
Outflow–cloud interaction region in the western lobe of the DR2l Main outflow. The grayscale shows the integrated HCO+ emission between −50 and 50 km s−1 relative to the source velocity. Red contours show line emission of HCN (top), H2CO (middle), and HNC (bottom). Blue contours show the emission of N2H+ and green contours show the emission of SiO, in all panels. Contour levels are at 5, 10, and 20 σrms. The dashed black lines in the middle plot mark the lines used to calculate the average intensities and first moments across the interaction front presented in Figs. 12–17. The orange rectangle marks the area actively affected by the interaction as derived from these intensities.
Current usage metrics show cumulative count of Article Views (full-text article views including HTML views, PDF and ePub downloads, according to the available data) and Abstracts Views on Vision4Press platform.
Data correspond to usage on the plateform after 2015. The current usage metrics is available 48-96 hours after online publication and is updated daily on week days.
Initial download of the metrics may take a while.