Fig. 5
Download original image
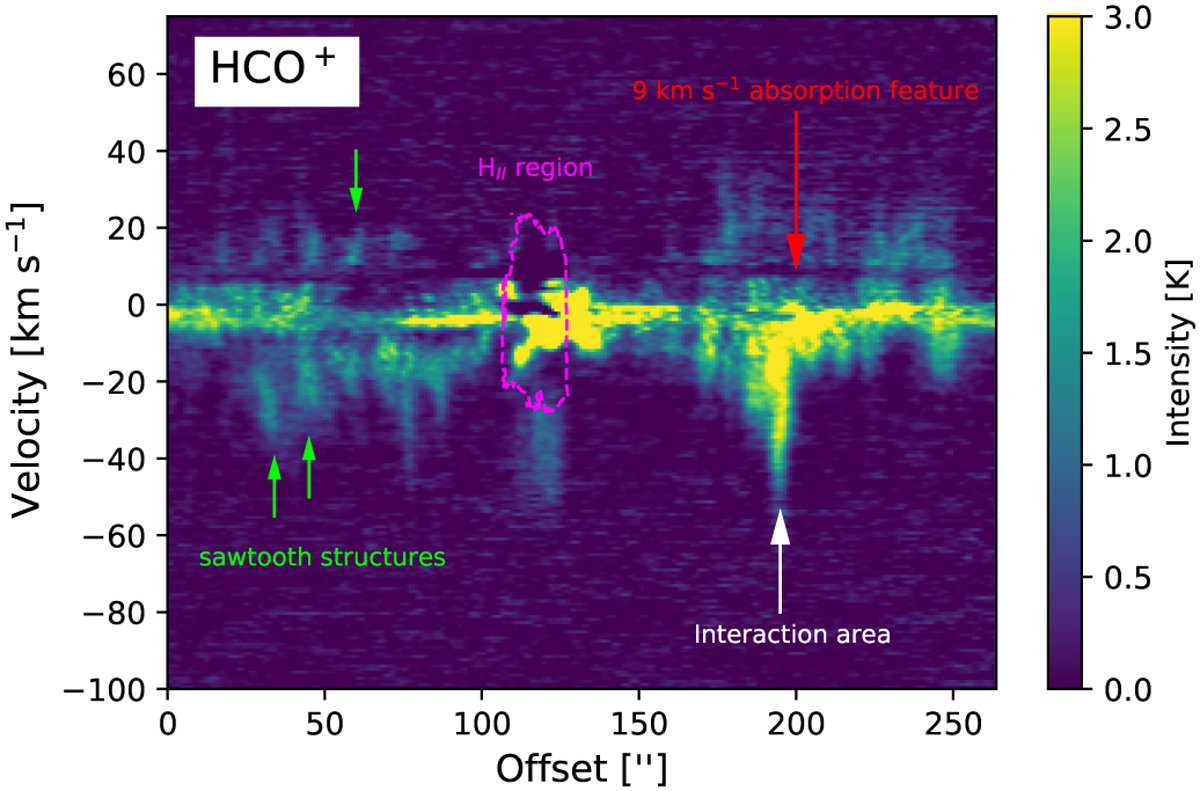
Position–velocity diagram for HCO+ emission along the DR21 Main outflow. The offset is measured from the edge of the eastern lobe towards the west. The arrow points to the 9 km s−1 absorption feature (Dickel et al. 1978), the white arrow highlights the location of the interaction region (this work), the magenta dashed contour marks the H41α emission from the Η II region, and the light green arrows mark examples of sawtooth pattern structures (Santiago-García et al. 2009).
Current usage metrics show cumulative count of Article Views (full-text article views including HTML views, PDF and ePub downloads, according to the available data) and Abstracts Views on Vision4Press platform.
Data correspond to usage on the plateform after 2015. The current usage metrics is available 48-96 hours after online publication and is updated daily on week days.
Initial download of the metrics may take a while.