Fig. 16
Download original image
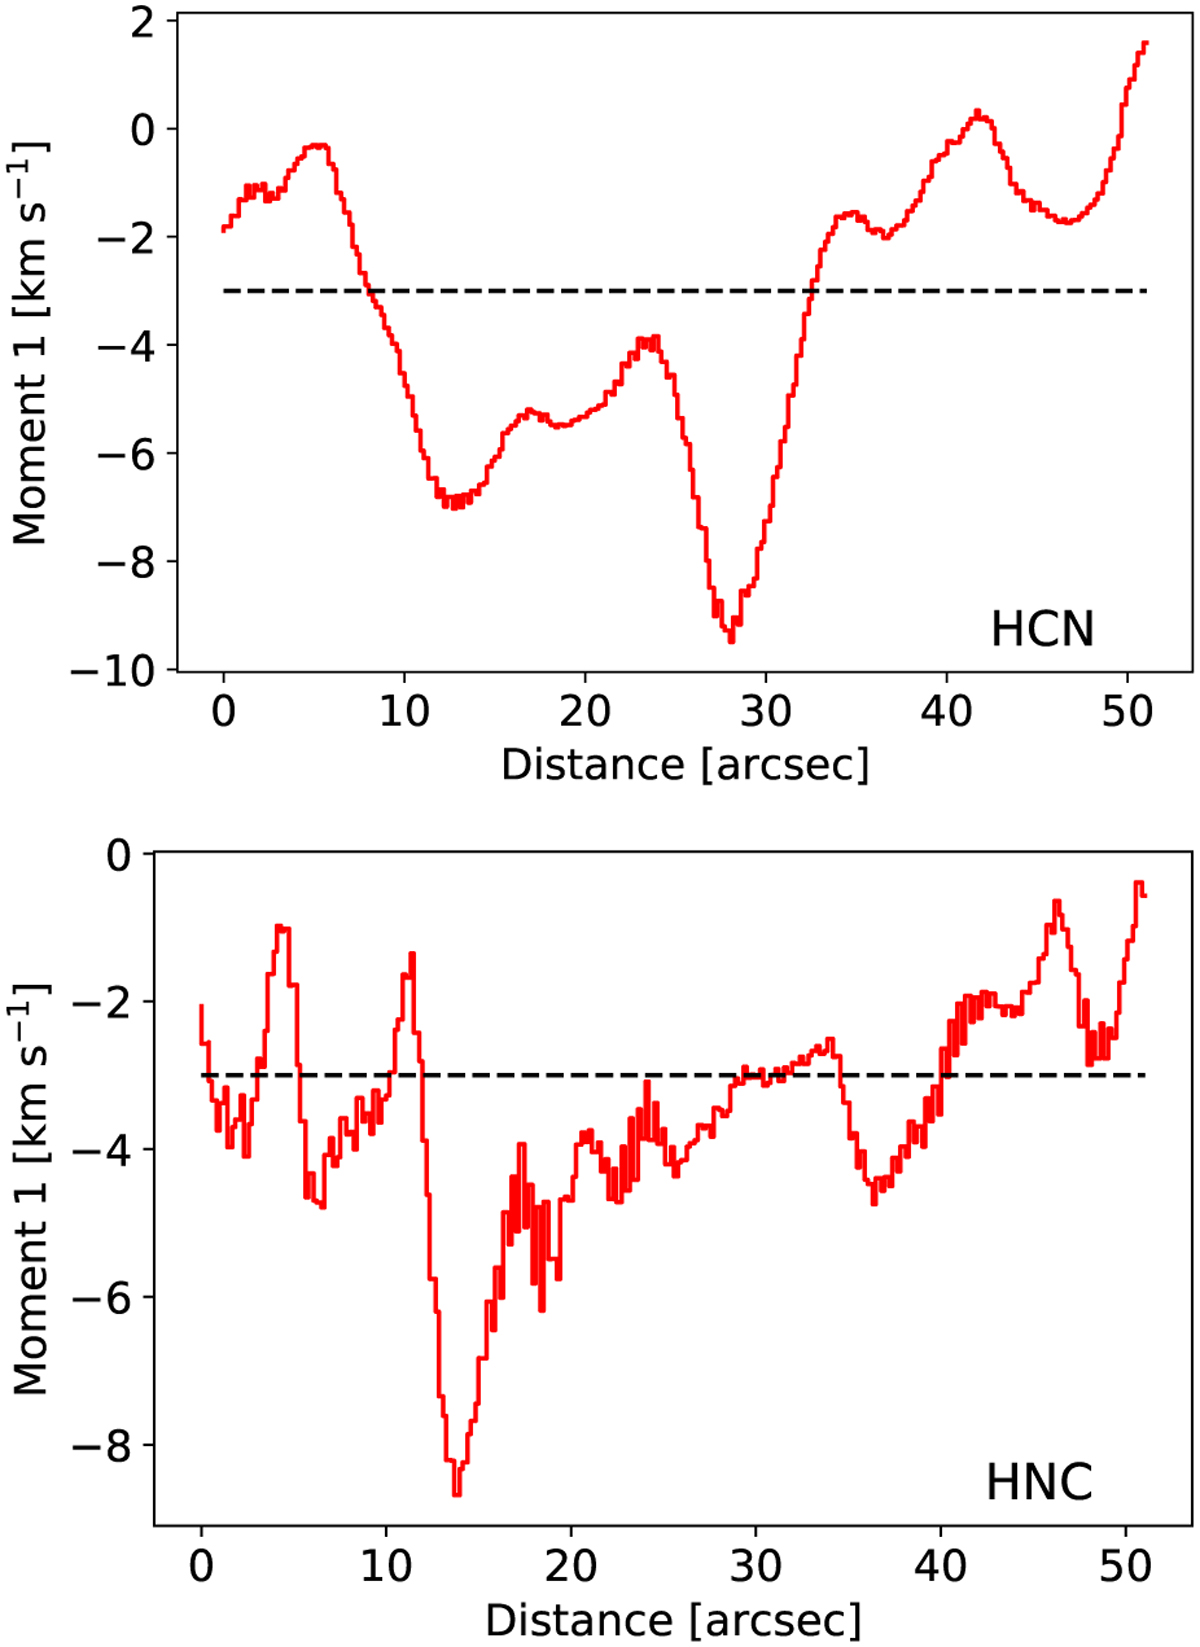
First moment across the interaction front of the DR21 Main outflow and the dense structure located near the western outflow lobe plotted over the corresponding distance. The distance is measured from the outflow-dominated part and extends into the dense structure. The black dashed line marks the DR21 cloud velocity of υcloud = −3 km s−1. Top: For HCN emission Bottom: for HNC emission.
Current usage metrics show cumulative count of Article Views (full-text article views including HTML views, PDF and ePub downloads, according to the available data) and Abstracts Views on Vision4Press platform.
Data correspond to usage on the plateform after 2015. The current usage metrics is available 48-96 hours after online publication and is updated daily on week days.
Initial download of the metrics may take a while.