Open Access
Fig. A.1
Download original image
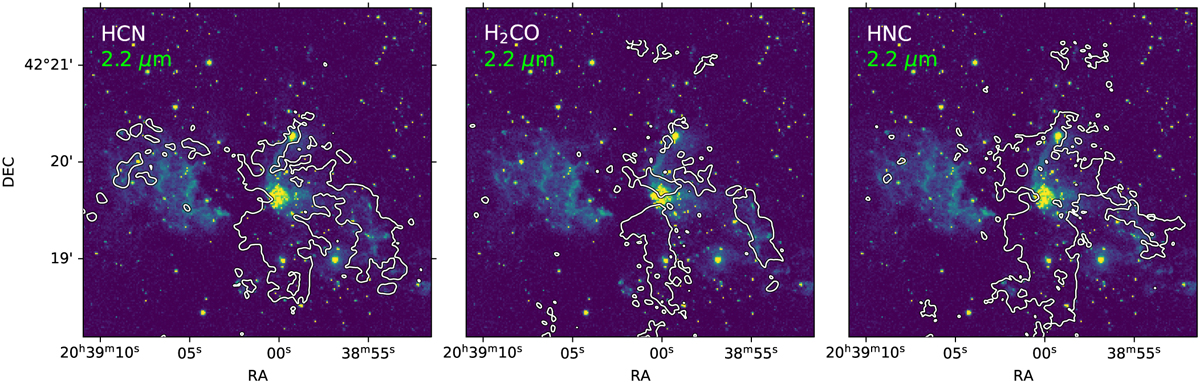
UKIRT/WFCAM continuum image of the DR21 Main region at 2.2 µm and the line emission in key gas tracers observed as part of CASCADE. White contours mark the 5σ HCN (left), H2CO (middle), and HNC (right) emission.
Current usage metrics show cumulative count of Article Views (full-text article views including HTML views, PDF and ePub downloads, according to the available data) and Abstracts Views on Vision4Press platform.
Data correspond to usage on the plateform after 2015. The current usage metrics is available 48-96 hours after online publication and is updated daily on week days.
Initial download of the metrics may take a while.