Fig. 3
Download original image
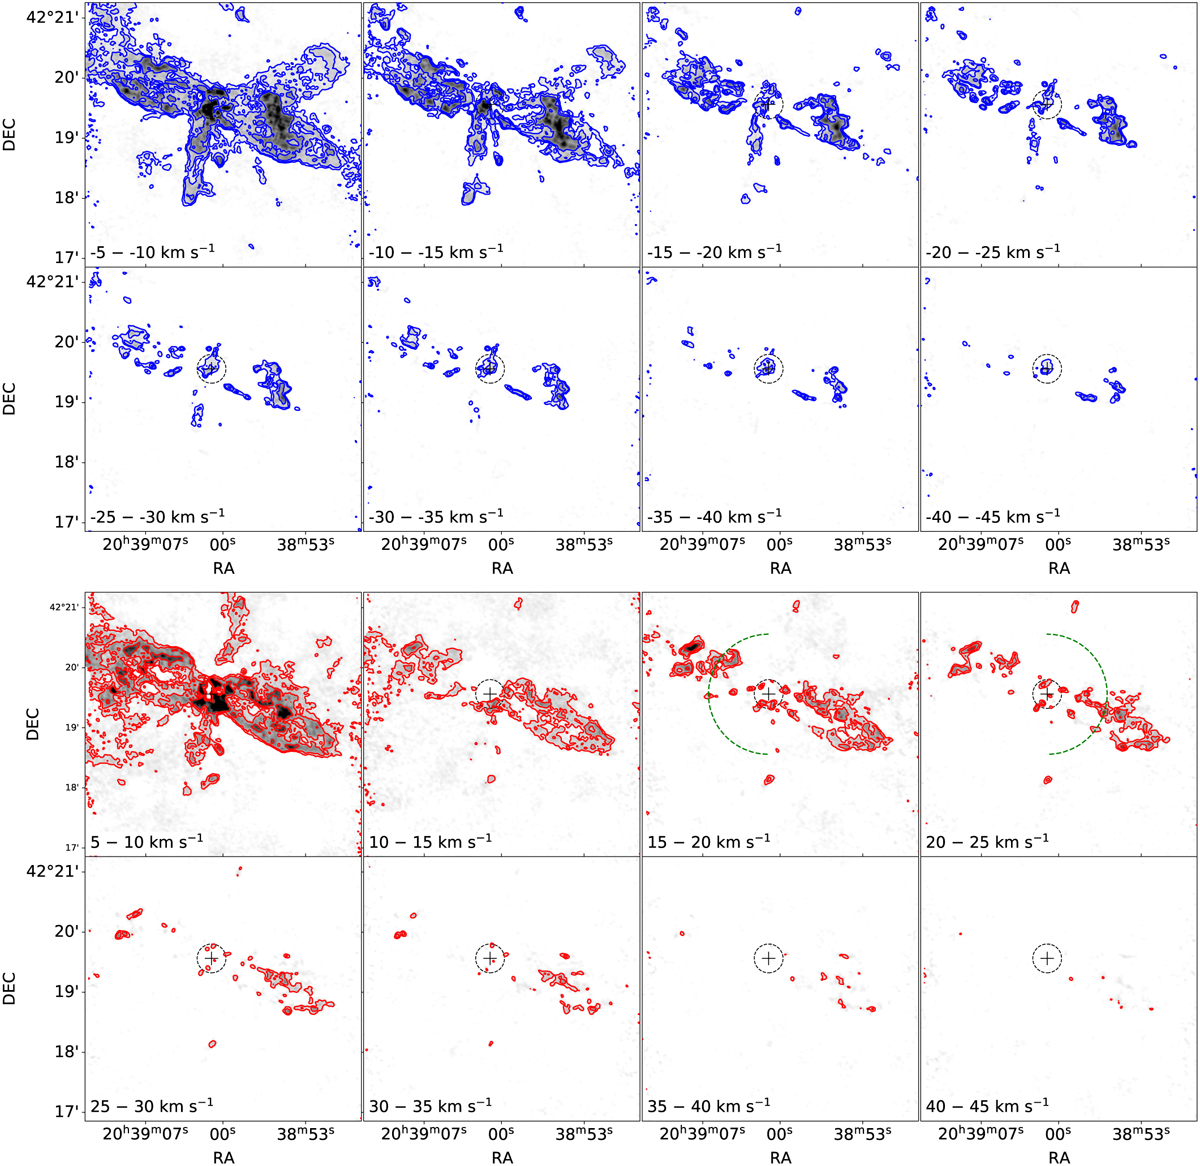
Channel maps of the DR21 Main outflow in HCO+. Contours of the blueshifted HCO+ emission (in blue) and redshifted emission (in red) are integrated over velocity steps of 5 km s−1 and are plotted over the corresponding grayscale. The full velocity range is from 5 to 45 km s−1 relative to the source velocity (−3 km s−1) and the contour levels correspond to 5, 10, and 20 σrms. The black dashed circle shows the area of the DR21–1 core in Cao et al. (2019). The green dashed lines denote the half-circles used to derive the outflow opening angles (see Fig. 7).
Current usage metrics show cumulative count of Article Views (full-text article views including HTML views, PDF and ePub downloads, according to the available data) and Abstracts Views on Vision4Press platform.
Data correspond to usage on the plateform after 2015. The current usage metrics is available 48-96 hours after online publication and is updated daily on week days.
Initial download of the metrics may take a while.