Fig. 12
Download original image
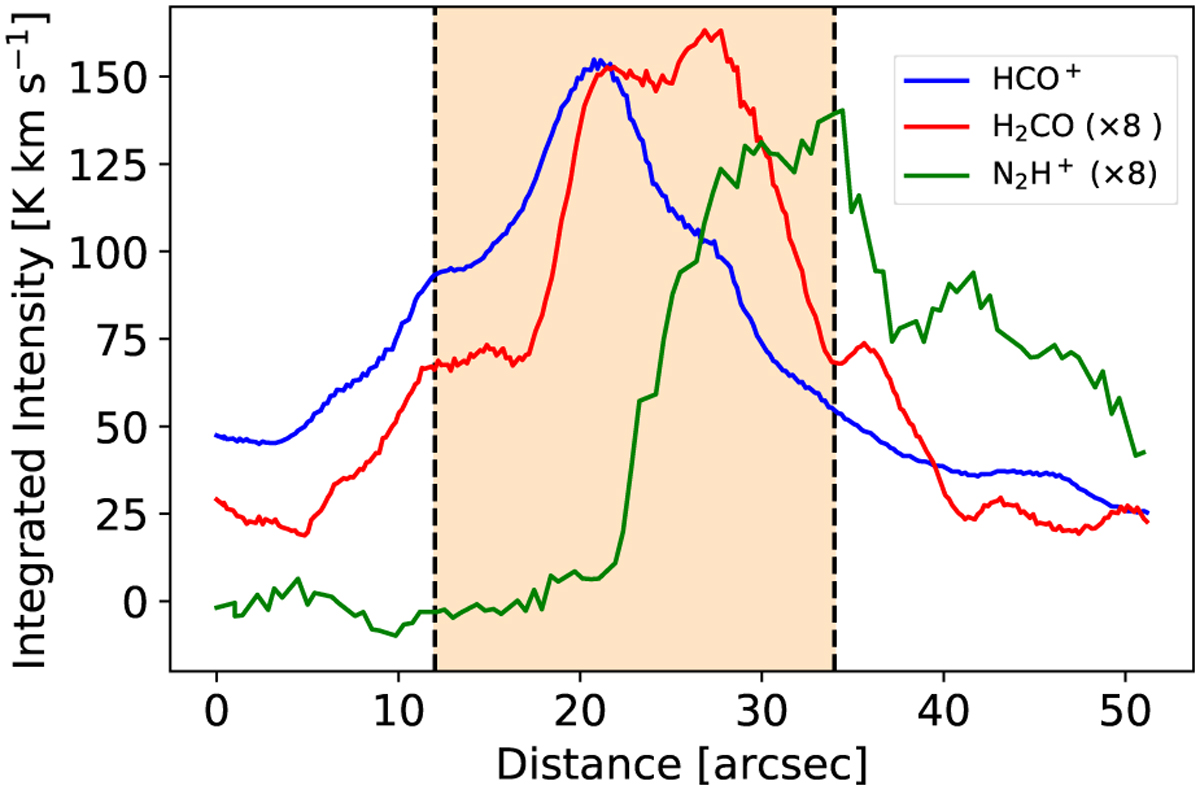
Average integrated intensities of HCO+ (in blue), H2CO (in red), and N2H+ (in green) across the interaction region in the western lobe of DR2l. Intensities are integrated from −70 to 70, from −20 to 20, and from −20 to 10 km s−1 for HCO+, H2CO, and N2H+, respectively. The x-axis shows the distance in arcseconds covering the extent of the relevant region where the outflow interacts with a dense structure (marked also in Fig. 11). The orange rectangle shows the area actively affected by the interaction. The intensities for H2CO and N2H+ are scaled up by a factor of 8 in order for their distributions to be more easily comparable.
Current usage metrics show cumulative count of Article Views (full-text article views including HTML views, PDF and ePub downloads, according to the available data) and Abstracts Views on Vision4Press platform.
Data correspond to usage on the plateform after 2015. The current usage metrics is available 48-96 hours after online publication and is updated daily on week days.
Initial download of the metrics may take a while.