Fig. 15
Download original image
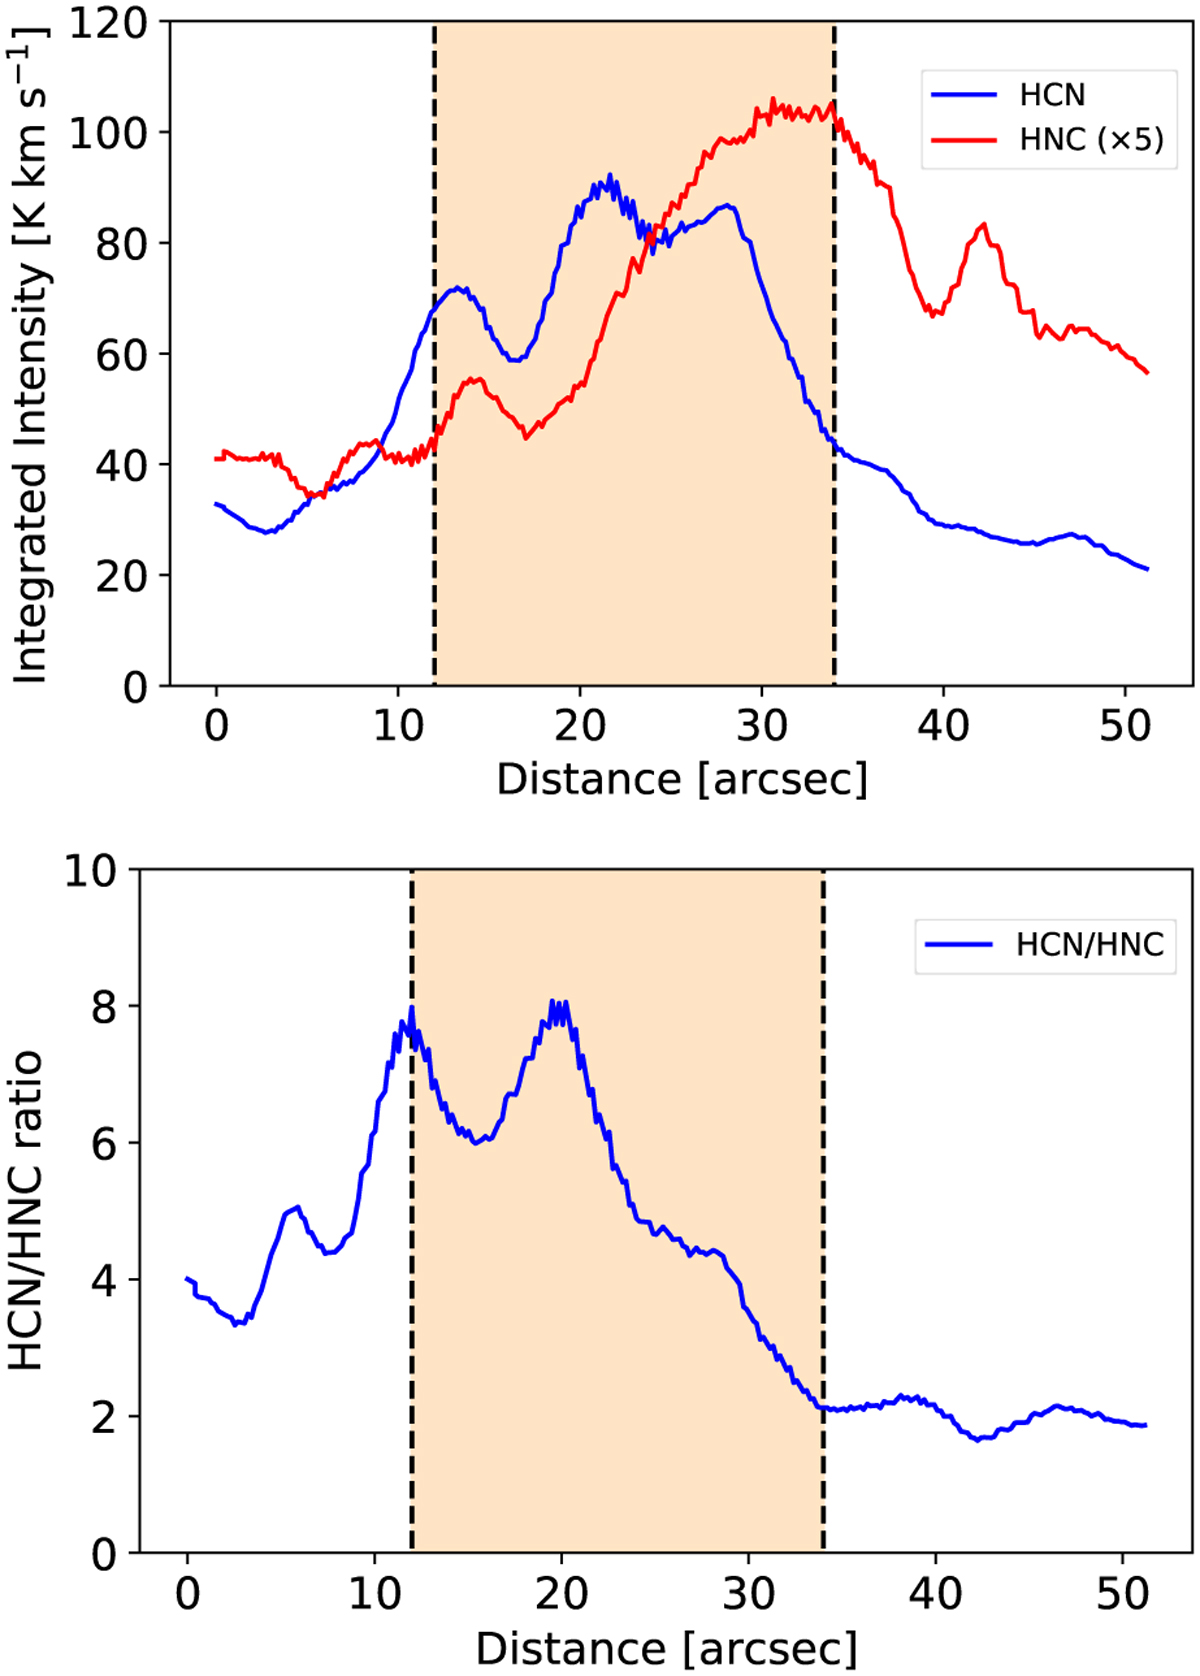
HCN and HNC emission in the interaction region. Top: average integrated intensities of HCN (in blue) and HNC (in red) across the interaction region in the western lobe of DR21. Intensities are integrated from −35 to 35 and from −15 to 10 km s−1 for HCN and HNC, respectively. The HNC emission is scaled up by a factor of 5 for clarity. Bottom: ratio of HCN over HNC across the interaction region.
Current usage metrics show cumulative count of Article Views (full-text article views including HTML views, PDF and ePub downloads, according to the available data) and Abstracts Views on Vision4Press platform.
Data correspond to usage on the plateform after 2015. The current usage metrics is available 48-96 hours after online publication and is updated daily on week days.
Initial download of the metrics may take a while.