| Issue |
A&A
Volume 650, June 2021
|
|
|---|---|---|
| Article Number | A84 | |
| Number of page(s) | 31 | |
| Section | Extragalactic astronomy | |
| DOI | https://doi.org/10.1051/0004-6361/202039642 | |
| Published online | 10 June 2021 | |
Interactions between large-scale radio structures and gas in a sample of optically selected type 2 quasars⋆
1
Centro de Astrobiología, CSIC-INTA, Ctra. de Torrejón a Ajalvir, km 4, 28850 Torrejón de Ardoz, Madrid, Spain
e-mail: This email address is being protected from spambots. You need JavaScript enabled to view it.
2
National Radio Astronomy Observatory, 520 Edgemont Road, Charlottesville, VA 22903, USA
3
GRANTECAN, Cuesta de San José s/n, 38712 Breña Baja, La Palma, Spain
4
Instituto de Astrofísica de Canarias, Vía Láctea s/n, 38200 La Laguna, Tenerife, Spain
5
Centro de Astrobiología, CSIC-INTA, ESAC Campus, 28692 Villanueva de la Cañada, Madrid, Spain
6
Instituto de Astrofísica e Ciências do Espaço, Universidade do Porto, CAUP, Rua das Estrelas, 4150-762 Porto, Portugal
7
Departamento de Astronomia, Universidade Federal do Rio Grande do Sul, IF, CP 15051, 91501-970 Porto Alegre, RS, Brazil
8
Harvard-Smithsonian Center for Astrophysics, 60 Garden St., Cambridge, MA 02138, USA
Received:
10
October
2020
Accepted:
10
March
2021
Abstract
Context. The role of radio mode feedback in non radio-loud quasars needs to be explored in depth to determine its true importance. Its effects can be identified based on the evidence of interactions between the radio structures and the ambient ionised gas.
Aims. We investigate this interaction in a sample of 13 optically selected type 2 quasars (QSO2) at z < 0.2 with the Very Large Array (VLA) FIRST Survey radio detections, none of which are radio-loud. The ranges of [OIII]λ5007 and monochromatic radio luminosities are log(L[OIII]/erg s−1) ∼ 42.08–42.79 and log(P1.4 GHz/erg s−1 Hz−1) ∼ 30.08−31.76. All of them show complex optical morphologies, with signs of distortion across tens of kpc due to mergers and interactions.
Methods. We searched for evidence of interactions between the radio structures and the ionised gas by characterising and comparing their morphologies. The former was traced by narrow band Hα images obtained with the GTC 10.4 m Spanish telescope and the Osiris instrument. The latter is traced by VLA radio maps obtained with A and B configurations to achieve both high resolution and brightness sensitivity.
Results. The radio luminosity has an active galatic nucleus (AGN) component in 11 our of 13 QSO2, which is spatially extended in our radio data in 9 of them (jets, lobes, or other). The relative contribution of the extended radio emission to the total P1.4 GHz is in most cases in the range from 30% to 90%. The maximum sizes are in the range of dRmax of around a few to 500 kpc. The QSO2 undergoing interaction or merger events appear to be invariably associated with ionised gas spread over large spatial scales with maximum distances from the AGN in the range rmax ∼ 12−90 kpc. The morphology of the ionised gas at < 30 kpc is strongly influenced by AGN related processes. Evidence for radio-gas interactions exist in 10 out of 13 QSO2; that is, in all but one with confirmed AGN radio components. The interactions are identified across different spatial scales, from the nuclear narrow line region up to tens of kpc.
Conclusions. Although this sample cannot be considered representative of the general population of QSO2, it supports the idea that large-scale low to modest power radio sources can exist in radio-quiet QSO2, which can provide a source of feedback on scales of the spheroidal component of galaxies and well into the circumgalactic medium, in systems where radiative mode feedback is expected to dominate.
Key words: quasars: general / galaxies: jets / galaxies: active / galaxies: evolution
Reduced images are only available at the CDS via anonymous ftp to cdsarc.u-strasbg.fr (130.79.128.5) or via http://cdsarc.u-strasbg.fr/viz-bin/cat/J/A+A/650/A84
© ESO 2021
1. Introduction
Type 2 quasars (QSO2) offer a very interesting opportunity for investigating feedback in the general population of quasars (QSO). The accretion disk and the broad line region (BLR) are occulted by obscuring material, allowing for a detailed study of the surrounding medium. This is more complex in the unobscured counterparts, type 1 QSO (QSO1), due to the dominant contribution of the nuclear point spread function.
Over the past decade, it has become clear that ionised outflows are ubiquitous in QSO2 at different redshifts, z (e.g., Villar-Martín et al. 2011, 2014, 2016; Greene et al. 2011; Mullaney et al. 2013; Zakamska & Greene 2014; Bellocchi et al. 2019). They generally appear to be triggered by processes related to nuclear activity (e.g., Greene et al. 2011; Mullaney et al. 2013; Villar-Martín et al. 2014; Zakamska & Greene 2014; Jarvis et al. 2019), however, the dominant specific mechanism is uncertain. The quasar mode, in which the intense flux of photons and particles produced by the transfer of energy and momentum from the active galactic nucleus (AGN) to the surrounding environment (Fabian 2012; King & Pounds 2015) is often assumed to be dominant because of their high AGN luminosities and accretion rates and the fact that only ∼10–15% QSO2 are radio loud (RL, Lal & Ho 2010; Zakamska & Greene 2014). For this same reason, the role of radio mode feedback, where the bulk of the energy is ejected in kinetic form through jets coupled to the galaxies’ gaseous environment, has been often considered irrelevant.
The nature of the radio emission in radio quiet quasars (RQQ) is still a matter of debate, whether it is dominated by star formation in the host galaxy (Padovani et al. 2011; Bonzini et al. 2013; Condon et al. 2013; Kellermann et al. 2016) or by non-thermal emission due to mechanisms driven by the nuclear activity (e.g., Maini et al. 2016; Herrera Ruiz et al. 2016; Zakamska et al. 2004, 2016). The relative contribution of AGN-related processes appears to increase with radio luminosity (Kimball et al. 2011; Kellermann et al. 2016).
Zakamska & Greene (2014) studied the radio luminosity of 568 objects out of the entire sample of QSO2 at z ≲ 0.83 in the Sloan Digital Sky Survey (SDSS, York et al. 2000) selected by Reyes et al. (2008). The median redshift is zmed = 0.397. The authors conclude that the origin of the radio emission for those with Faint Images of the Radio Sky at Twenty-Centimeters (FIRST) detections (∼65%) is unlikely to be due to star formation, but rather to AGN-related processes instead (see also Lal & Ho 2010).
The authors inferred a median monochromatic 1.4 GHz luminosity log(P1.4) = log(P1.4 GHz/erg s−1 Hz−1) = 30.851. When compared with the general population of RL AGN, this value is surprisingly high for an object class often referred to as predominantly radio-quiet (see also Kellermann et al. 2016). Best et al. (2005) identified ∼2100 RL AGN in the second data release of the SDSS (zmed ∼ 0.1). At least 30% have log(P1.4) below the QSO2 median monochromatic luminosity. Radio AGN with log(P1.4) ≲ 31.5 (the range spanned by most QSO2) currently attract great interest concerning the role of mechanical feedback in galaxies since, as shown by Best et al. (2005), they greatly outnumber their high-luminosity counterparts.
Therefore, independently of the classification in terms of radio-loudness and the fact that the radio emission of optically selected QSO2 is low or modest relative to the optical output, many host AGN-driven radio sources of significant power in comparison with the general population of radio AGN. Whether these interact with the ambient gas and provide a mechanism of efficient feedback is an open question and, thus, the role of radio mode feedback in QSO2 (non RL quasars in general) needs to be explored in depth to determine its true importance.
The frequency of jets and related structures (hot spots, lobes) in QSO2 and, more generally, non-radio loud quasars (RQ and RI) is uncertain. Large-area radio surveys typically lack the sensitivity to detect or resolve the radio structures and for this reason, the precise mechanism that produces the AGN radio emission is often difficult to discern. For instance, whether it is lobes, or hot spots versus relativistic particles accelerated in the shocks produced by quasar-driven outflows (Zakamska & Greene 2014; Panessa et al. 2019). Jarvis et al. (2019) have recently suggested that radio jets and lobes with modest radio luminosities and sizes of up to 25 kpc may be common in QSO2 and may provide a crucial feedback mechanism for massive galaxies during a quasar phase. Moreover, even in systems where the radio emission appears to be dominated by star formation, this does not exclude the existence of jets.
Radio mode feedback has been observed in Seyferts and RQQ for decades (e.g., Wilson & Ulvestad 1983; Whittle 1992; Leipski et al. 2006; Mullaney et al. 2013; Husemann et al. 2013; Tadhunter et al. 2014; Alatalo et al. 2015; Aalto et al. 2020). Radio jets have now been identified even in galaxies which host weakly active or silent super-massive black holes (SMBH), including the Milky Way (Baldi et al. 2018; Issaoun et al. 2019). Thus, SMBH driven jets may exist in many galaxies, even if they may exhibit such low levels of nuclear activity that they are considered inactive.
Various works suggest that the most kinematically extreme nuclear ionised outflows in AGN with low to modest radio luminosities (log(P1.4) ≲ 31.0), including QSO2, are triggered by compact (≲few kpc) radio jets (Mullaney et al. 2013; Villar-Martín et al. 2014; Molyneux et al. 2019). Studies of large-scale (> several kpc from the AGN, well beyond the nuclear region) radio induced feedback in non-radio loud QSO, including QSO2, are very scarce (Husemann et al. 2013; Villar-Martín et al. 2017; Jarvis et al. 2019). Recently, we discovered radio-induced feedback across large scales in the Beetle galaxy, which is a radio-quiet QSO2 at z = 0.1 (Villar-Martín et al. 2017). Even though the radio emission in the Beetle was classified as compact based on archival survey data, deep VLA imaging revealed an extended radio structure with hot-spots stretching almost 50 kpc. The extended radio emission was detected only at the mJy level and was thus too faint to be detected in surveys. Still, this faint radio source interacts with the circumgalactic gas far outside the galaxy. The Beetle galaxy revealed that radio jets of modest power can be a relevant feedback mechanism acting across large scales, even in non-radio loud QSOs.
The purpose of our current work is to investigate whether extended, low-power radio sources, analogous to what we previously observed in the Beetle galaxy, can be hiding in radio-quiet QSO2 and providing a source of feedback across large scales. We investigate this in a sample of optically selected QSO2 at z < 0.2, based on the morphological characterisation of the ionised gas and the radio structures and the relative comparison. The first is traced by narrow band Hα images obtained with the GTC 10.4 m Spanish telescope. The second is traced by radio maps obtained with the Karl G. Jansky Very Large Array (VLA).
The paper is organised as follows. We describe the sample and observations in Sects. 2 and 3, respectively. General results are presented in Sect. 4 and discussed in Sect. 5. Summary and conclusions are given in Sect. 6. The results on individual objects are explained in Appendix A. We assume the cosmological parameters H0 = 71, ΩM = 0.27, and ΩΛ = 0.73 and we calculate distances following Wright (2006).
2. Sample selection
The VLA sample consists of 12 objects from the SDSS catalogue of QSO2 at z < 0.2 by Reyes et al. (2008) (Table 1). Eight of the above objects were observed with GTC to map the Hα morphology. Hubble Space Telescope (HST) or SDSS images were used for objects that could not be observed with GTC. Although not in our VLA program, we also included the Teacup in this sample to map the morphology of the giant (∼110 kpc) nebula discovered by Villar-Martín et al. (2018). The extended radio emission of this QSO2 has been studied in detail by Harrison et al. (2015) and Jarvis et al. (2019).
Sample and its general properties.
2.1. Optical properties
Our main interest is to investigate radio induced feedback across galactic and extragalactic scales. For this mechanism to operate and be detectable, the radio source must interact with widely spread gas. For this reason, the z < 0.2 QSO2 were selected to show complex optical morphologies, with signs of morphological distortion across tens of kpc due to mergers and interactions. This suggests that the objects may be associated with a large-scale gaseous environment. The identification of the optical distortion was based on SDSS or HST available images. No constraints were applied regarding prior evidence or strength of nuclear ionised outflows. The range of [OIII] luminosities is log(L[OIII]) ∼ 42.08−42.79 in erg s−1 (the log of the median is 42.42), which is the same spanned by QSO2 at similar z (Fig. 1).
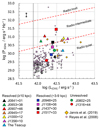 |
Fig. 1. Location of the object sample (large symbols) in the [OIII]λ5007 vs. monochromatic 5.0 GHz luminosity plane (Xu et al. 1999). Triangles are used for radio sources with total sizes |


2.2. Radio properties
2.2.1. Radio-loudness
The objects were selected to have FIRST and NRAO VLA Sky Survey (NVSS) 1.4 GHz detections and, in some cases, to show solid or tentative evidence for extended AGN driven radio sources (see below). The range of monochromatic radio luminosities is log(P1.4) ∼ 30.08−31.76 (Table 1). The log of the median is 31.15.
To classify them according to the radio-loudness, we show in Fig. 1 their location in the log(P5 GHz) (rest frame value) versus the log(L[OIII]) plane following Xu et al. (1999). P5 GHz was calculated using the 5 GHz fluxes, S5 GHz, when available (Rosario et al. 2010; Jarvis et al. 2019; Bondi et al. 2016); when not available, we computed S5 GHz with the NVSS 1.4 GHz fluxes and assumed a spectral index α = −0.864 ± 0.222 (with Sν ∝ να). This is the median inferred for the range of α values measured by Jarvis et al. (2019) for their QSO2 sample. The K-correction is negligible. We also plotted in Fig. 1 all QSO2 at z < 0.2 Reyes et al. (2008) catalogue. For objects with no NVSS or FIRST detections, a 5σ upper limit from FIRST of 1 mJy has been used.
The classification is shown in (Table 1). Seven have high radio powers that place them in or near the RI region. Most importantly, most QSO2 in our sample are at the high end of the radio luminosities spanned by QSO2 at similar z.
A more quantitative approach to the aspect of ‘radio-loudness’ can be taken by looking at the q parameter, which is a measure of the FIR/radio flux-density ratio (Helou et al. 1985):
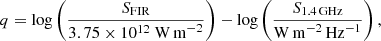 (1)
(1)
where S1.4 GHz is in units of W m−2 Hz−1 and SFIR = 1.26 × 10⁻¹⁴ (2.58 S60 μm + S100 μm) W m−2. S60 μm and S100 μm) are the IRAS fluxes at 60 and 100 μm in W m−2. The q values are shown in Table 1 when available. Objects with q ≤ 1.8 show an excess of radio emission above that expected from star formation and, therefore, they have a significant AGN contribution (Villar-Martín et al. 2014). This is the case for seven of the nine objects with measured q, while the radio emission is consistent with star formation in two (J1108+06 and J1316+44). We note that this does not negate the existence of AGN-driven radio structures. As an example, the Beetle QSO2 has q = 1.89 ± 0.10 and it is associated with a ∼4 kpc jet and a large-scale (∼46 kpc) radio source (Villar-Martín et al. 2017).
2.2.2. Extended radio emission
As part of our sample selection, we compared the flux density values from FIRST (peak and integrated,  and
and  ) and NVSS (integrated, SNVSS) 1.4 GHz fluxes. Our sample consists of sources for which
  , and where this difference could indicate radio continuum emission at the mJy level on scales larger than the 5″ beam of FIRST. This would mimic the case of the Beetle Galaxy (Villar-Martín et al. 2017). We note, however, that differences between
  and SNVSS in some cases are close to, or within, the quoted uncertainties in the flux density estimates and could also be the result of source variability.
In order to obtain a rough prior indication about the likely existence of radio emission extended on scales of ≳5″ in our sample sources, we follow Kimball & Ivezić (2008), who calculated log(θ2), with  , and
, and 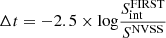 . Here, θ gives a dimensionless source concentration on ∼5″ scale. Sources with log(θ2) < 0.05 and ≥0.05 are classified as highly concentrated (or ‘unresolved’ as per the authors terminology) and extended (‘resolved’), respectively. So, Δt provides a measurement of source morphology that indicates angular extent and complexity. Kimball & Ivezić (2008) found a bimodal distribution, such that sources with Δt ∼ 0 are single component sources, while those with Δt ∼ 0.7 are multiple-component or extended. Following their approach, we classified roughly sources with Δt < 0.35 as ‘simple’ and those with Δt ≥ 0.35 as ‘complex’ (Table 2).
Classification of the QSO2 VLA sample according to the possible existence of extended (5″) radio emission based on Kimball & Ivezić (2008).
At the time of the observations, there was no evidence for extended radio emission on scales of ≳5″ for 4 out of 12 objects (J0802+25, J1316+44, J1356+10 and J1437+30), while radio emission was suspected or confirmed to be extended for 7 objects (J0841+01, J0853+38, J0907+46, J0945+17, J1000+06, J1108+06, and J1517+33), as well as the Teacup. J0948+25 was uncertain due to the possible contamination of the NVSS flux by a nearby source. We note, however, that this a priori classification is only approximate. For instance, sources with very bright compact cores and faint extended structures will be classified as ‘unresolved’ and ‘simple’. This is the case of the Beetle (log(θ2) = 0.033 and Δt = 0.204). Also J1108+06, classified as ‘unresolved’ and ‘simple’ using the above method, is known to be associated with a multicomponent ∼3″ radio source (Bondi et al. 2016). Therefore, to reach our goal of investigating how common extended radio structures at the mJy level are in radio-quiet and radio-intermediate QSO2, our sample covers a wide range of log(θ2) and Δt.
Nevertheless, with all the above restrictions, the sample cannot be considered representative of the general population of QSO2. The objects are characterised by complex optical morphologies. They were selected with FIRST detections, with many having relatively high radio luminosities in comparison with SDSS QSO2 in the same z range, and some having prior indications for the presence of extended radio emission.
3. Observations
3.1. 10.4 m Gran Telescopio CANARIAS
The Gran Telescopio Canarias (GTC) observations were performed on 23/06/2019 (program GTC28-19A) and 16-17/02/2020 (GTC114-19B) for 10 QSO2 in the sample (Table 3).
Log of GTC observations.
Hα Tunable filter (TF) images were obtained with the OSIRIS instrument2 mounted on the 10.4 m GTC. This is an optical imager and spectrograph that offers broad band photometry, tunable filter imaging and both multi-object and long slit spectroscopy. OSIRIS consists of a mosaic of two 2048 × 4096 Marconi CCD42-82 (with a 9.4″ gap between them) and covers the wavelength range from 0.365 to 1.05 μm with a field of view of 7.8′ × 7.8′ and a pixel size of 0.127″. However, the OSIRIS standard observation modes use 2 × 2 binning, hence the effective pixel size during our observations was 0.254″.
When using OSIRIS TF imaging mode the wavelength observed changes relative to the optical centre following the formula given by:
 (2)
(2)
where r is the distance in arcmin to the optical centre.
For this reason, for each QSO2 a filter full width at half maximum (FWHM) of 20 Å was used at the QSO2 that were z-centred on the redshifted Hα and taking into account the dependence of the wavelength observed with the red TF with distance relative to the optical centre described above. Also, to sample the continuum near the Hα+[NII] complex in each QSO we took one continuum image using an appropriate OSIRIS Red Order Sorter (OS) filters. These are medium-band filters (17 nm wide) initially used to isolate different interference orders within the TF, but that can also be used alone to produced direct imaging if needed. Both in direct TF and continuum (OS) imaging a three-dither pattern was used by moving the telescope ±15″ in RA and Dec to correct for ghost images and cosmic rays. Total exposure times and corresponding order filters used are described in Table 3, where the details on the observations are summarised. The seeing size during the observations was in the range of ∼0.9–1.4″ depending on the object.
A detailed description on the TF reduction process can be found in Villar-Martín et al. (2017). Briefly, the TF and the OS filter OSIRIS images were bias and flat-field corrected as usual, using a set of bias frames and sky flats. Then, images are sky subtracted by fitting a 1D polynomial both in x/y dimensions in order to remove the effect of the sky lines in the images, which appear as rings of emission over the CCDs due to the wavelength change produced by the TF described by Eq. (2)). Longer exposures (typically 3 × 900 s and 3 × 200 s for the TF and continuum images, respectively) were obtained to map the low surface-brightness (SB) extended structures. Because the nucleus saturates in these frames, shorter exposures (90 and 60 s for the TF and continuum images, respectively) were also obtained to ensure the availability of unsaturated images for all objects. These will be mentioned only when relevant.
The TF Hα images were calibrated in flux applying the method described in Cabrera-Lavers et al. (2014). Galactic extinction correction was not applied as it is negligible. The short exposure images (and, thus, not saturated) were used to compare the nuclear fluxes with those measured from the SDSS spectra. A circular aperture of 3″ diameter, as the SDSS fibre, was used for this. For each object, the SDSS flux was measured within a spectral window with the same central λ and width (20 Å) as the TF image. The TF nuclear fluxes are within ∼90% of the SDSS fluxes.
The Hα and continuum images were then properly aligned and scaled. Based on the centroid of the stars in the aligned images and the position of some important features in the galaxies, we estimate that the alignment accuracy is better than ∼0.5 pixels. The scaled continuum images were then subtracted from the emission line images in order to produce the ‘pure’ Hα images. Detection limits of the final Hα images are in the range of 3σ ∼ (2.5−5.4) × 10−18 erg s−1 cm−2 arcsec−2 depending on the object.
3.2. Karl G. Jansky Very Large Array
Observations with the VLA were performed during the period Feb.−May 2019 in B-configuration and Aug.−Oct. 2019 in A-configuration (project VLA/19A-134), as well as 2h of Director’s Discretionary Time (DDT) during the reconfiguration from B- to A-configuration on 14 Nov. 2020 (project VLA/20B-428). We used the L-band system in standard continuum mode to cover the frequency range of 1−2 GHz. We performed snap-shot observations with standard phase, bandpass, and flux calibration, and visited each source at least three times to improve the (u, v)-coverage. The total on-source integration time per target was on average 60–90 min in B-configuration and 30 min in A-configuration (details are given in Table 4). The DDT observations of J1356+10 where tapered as to only include baselines equivalent to those in the B-configuration and added to the 90 min of data already taken for this source in B-configuration.
VLA information about the A and B-configuration observations.
The data were calibrated using the VLA CASA pipeline. Afterwards, a round of phase-only self calibration was attempted, but for most sources this solution did not improve the imaging and was therefore not applied. The data were subsequently imaged in CASA using the task tclean (McMullin et al. 2007; CASA Team, in prep.).
For imaging, we used a natural weighting for the B-configuration data and Briggs weighting with robustness parameter 0.5 for the A-configuration data (Briggs 1995). For the field of J1437+30, we also produced a map with super-uniform weighting in order to resolve bright radio structures on the smallest scales. To mitigate the effects from sidelobes of strong radio sources in the field, we imaged the full primary beam before doing the primary beam correction. However, because our target sources were located at the pointing centre, we did not need to use the wide-field imaging techniques to recover their structure and flux density. Upper limits on the sizes of unresolved sources are given by the beam sizes in Table 4.
4. Results
In this section, we present the general properties of the radio and ionised gas in our sample. We also present in Figs. 2–8, the overlays between the radio and Hα maps. We refer the reader to Appendix A for detailed descriptions and results of the individual QSO2. The information on the sizes and nature of the radio structures and the large-scale ionised gas for all objects are summarised in Tables 5 and 6 and Figs. 9 and 10.
 |
Fig. 2. GTC Hα image of J0841+01 on a log scale, with overlaid contours of the VLA A-configuration (red) and B-configuration (grey) data. Contour levels are the same as in Fig. A.1. The inset shows the contours of the VLA A-configuration data overlaid onto the smoothed HST [OIII]λ5007 continuum subtracted image from Storchi-Bergmann et al. (2018). In these and other radio-Hα overlays, the directions of the axes used to measure the degree of alignment between the radio (solid lines) and the ionised gas (dashed lines) structures are indicated. The same colour is used for axes on the same side of the AGN (see Sect. 4.3). |
 |
Fig. 3. GTC Hα image of J0853+38, with overlaid contours of the VLA A-configuration (red) and B-configuration (grey) data. Contour levels are the same as in Fig. A.3, and features indicated as image artefacts in the B-configuration data of Fig. A.3 have been omitted. |
 |
Fig. 4. GTC Hα image of J0907+46, with overlaid contours of the VLA A-configuration (red) and B-configuration (grey) data. Contour levels start at 0.08 (0.2) mJy bm−1 for the A (B) configuration data, and increase by factor 2. Radio and Hα axes as in Fig. 2. |
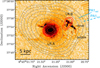 |
Fig. 5. HST/WFC FR551N (containing [OIII]) image of J0945+17, with overlaid contours of the VLA A (red) and B-configuration (grey) data. Contour levels start at 0.45 (0.5) mJy bm−1 for the A (B) configuration data, and increase by factor 2. LR:A and LR:B are the radio components identified by Jarvis et al. (2019). Radio and Hα axes as in Fig. 2. |
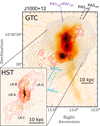 |
Fig. 6. GTC Hα image of J1000+12, with overlaid contours of the VLA A (red) and B-configuration (grey) data. Contour levels are the same as in Fig. A.12. The inset shows the contours of the VLA A-configuration data overlaid onto the HST WFC3/FQ508N narrow-band filter that contains [OIII] emission. The dashed black rectangle marks the approximate location of the giant [OIII] bubble proposed by Jarvis et al. (2019). The narrow extension of radio emission at this location, which we coloured light-red in the small panel, is most likely dominated by artefacts of the snap-shot imaging. LR:A to LR:D indicate the main radio components with the same nomenclature as in Jarvis et al. (2019). Radio and Hα axes as in Fig. 2. |
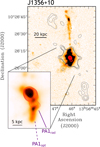 |
Fig. 7. J1356+10. GTC Hα image of J1356+10, with overlaid contours of the VLA A-configuration in red, and the extended emission from the B-configuration data in grey (see Fig. A.14 for details). The inset highlights the central region of the galaxy, with the GTC image shown at a higher contrast. Radio and Hα axes as in Fig. 2. |
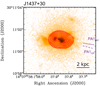 |
Fig. 8. J1437+30. HST/ACS image taken with the FR551N filter (covering [OIII]λ5007) with overlaid contours of the VLA A-configuration data with super-uniform weighting from Fig. A.21. The HST image is contaminated by continuum, but the high SB features trace the ionised gas morphology accurately (Fischer et al. 2018). Radio and Hα axes as in Fig. 2. |
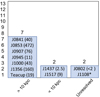 |
Fig. 9. Classification of the 11 QSO2 in our 13 QSO2 sample with confirmed AGN related radio emission according to the maximum size of the AGN component (in brackets). This coincides with |


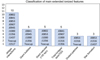 |
Fig. 10. Classification of the most interesting extended ionised features identified in the 13 QSO2 of our sample. The ‘giant nebulae’ describe large continuous reservoirs of gas with sizes > 35 kpc that are not identified with bubbles, tidal features (bridges or tails), with star formation (e.g., spiral arms) or with detached features (e.g., distant patches). ‘Jet-gas interactions’ refer to emission line features that are closely correlated with the radio morphology. This correlation indicates an interaction between the gas and the radio source. ‘Star formation’ encompasses detached compact knots and SF in spiral arms. ‘Distant patches’ refer to detached patches of ionised gas located at large distances from the AGN (tens of kpc). |
General properties of the radio structures.
General properties of the ionised nebulae.
4.1. Size, morphology, and origin of the radio structures
The contribution of an AGN component to the total radio luminosity is confirmed in 11/13 QSO2, all except J0948+25 and J1316+44. For these two objects, the available information does not allow to discern the origin (AGN or SF).
Out of these 11 QSO2, the AGN radio component is spatially unresolved in J0802+25 and J1108+06 (see Appendix A). The remaining 9 show extended AGN related radio structures with sizes that range between dmax ∼ few kpc at the spatial resolution of our data and up to almost 500 kpc (Table 5, Fig. 9). The relative contribution of these extended radio structures to the total radio luminosity at 1.4 GHz is in most cases in the range from 30% to 90% (Table 4).
Structures reminiscent of (or even confirmed as jets) are identified in all but J1437+33 (see also Jarvis et al. 2019). The jet sizes are in the range from 1 to a few kpc (J0945+17, J1000+12, J1356+10, the Teacup), ∼10 kpc (J1517+33), several tens of kpc (J0841+01, J0853+38, J0907+46). Additional extended AGN related radio structures (e.g., lobes or radio bubbles, plumes, hot spots) are detected in J0853+38 (472 kpc), J0841+01 (40 kpc), J1000+12 (43 kpc), J1356+10 (160 kpc), the Teacup (19 kpc). The radio component at ∼11 kpc from the AGN in J0945+17 may be a jet or a lobe. The lobe emission from the 160 kpc radio source in J1356+10 is extremely faint, and additional observations are necessary to unambiguously confirm and accurately image this emission. The structure of the extended radio source in J1437+33 (dmax ∼ 2.5 kpc) is unknown, but, as we argue in Appendix A, it is most likely related to the nuclear activity.
Therefore, this sample shows a high fraction of AGN related radio sources that extend for at least typical effective radii of the spheroidal component of galaxies (Urbano-Mayorgas et al. 2019) and often much more.
4.2. Size, line luminosity, and nature of the large-scale ionised gas
We find that QSO2 undergoing interaction and merger events appear to be invariably associated with ionised gas spread over large spatial scales, often well outside the main body of the galaxies, with maximum distances from the AGN in the range of rmax ∼ 12−92 kpc, with a median value of 46 kpc. The most spectacular case is the Teacup, which is associated with a ∼115 × 87 kpc nebula (Fig. A.16). The Hα luminosities of the extended structures are in the range of 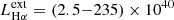 erg s−1 (median 3.5 × 1041 erg s−1) (Table 7)3. We show in Fig. 10 the classification of the most interesting extended ionised features and the objects where they have been identified. For comparison, Balmaverde et al. (2021) measured
  for a sample of 37 3C low z radio galaxies. Six have nuclear [OIII] luminosities in the same range as our QSO2 sample. These have
 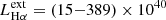 erg s−1 (median 1.0 × 1042 erg s−1). Although this comparison sample is small, the Hα luminosities of the extended nebulae appear to be higher in the radio-loud sample.
Luminosities of the extended Hα structures.
All QSO2 in our sample, except J0907+46, show unambiguous evidence for mergers and interactions based on the distorted optical continuum morphologies and the presence of prominent tidal continuum features. The Hα image confirms this is also the case for J0907+46 (Fig. A.7). Many of the large-scale (≳10 kpc) ionised features identified in our sample are remnants of the interaction and process. In some cases, they trace entire or partial tidal tails, bridges, or shells (e.g., J0841+01, J0907+46, J1000+12, J1316+44, and J1356+10; see also Villar-Martín et al. 2010, 2017). The extended ionised gas frequently overlaps partially with wide large and amorphous scale continuum halos clearly associated with a merging or interaction event (e.g., J0802+25, J1437+30, J1356+10, the Teacup).
Five QSO2 in our sample present firm or tentative evidence for giant bubbles of ionised gas: J0841+01, J0945+17, J1000+06, J1356+10 and the Teacup. The sizes ∼10 ± 2 kpc are similar in all of them. The Teacup (Keel et al. 2012), with clear morphological evidence, and J1356+10 and J1000+12, based on kinematic evidence, have been discussed by other authors (Greene et al. 2012; Jarvis et al. 2019).
We have proposed that J0841+01 and J0945+17 are also associated with giant ionised bubbles. We have identified a ∼10 kpc edge-brightened bubble on the W side of J0945+17 and, possibly, a counter-bubble to the E (Appendix A, Fig. A.10). The radio source is currently impacting on the western bubble and is enhancing the optical line emission at the location of the ‘cloud’ identified by Storchi-Bergmann et al. (2018). A past radio activity episode or a wide angle wind could have inflated the bubble(s). As for J0841+01, it is a dubious case. A striking set of ionised filaments is located between the two merging galaxies (Storchi-Bergmann et al. 2018, Appendix A, Fig. A.2). Based on the morphology and filamentary appearance, we propose that this is a giant (∼8 kpc) ionised edge brightened bubble. The apparent spatial overlap and similar size as the radio source (Fig. 2) suggests that it has been inflated by it. A wide angle wind cannot be refuted. Spectroscopy would be very useful to confirm or refute the nature of these bubble candidates.
A scenario in which a radio jet (∼few kpc) has inflated the bubbles has been also proposed for the Teacup (but see also Zakamska & Greene 2014), J1000+06, and the southern bubble of J1356+10 (Jarvis et al. 2019).
In addition to the ionised bubble candidates already reported in J1356+44 (Greene et al. 2012; Jarvis et al. 2019), we have found morphological tentative evidence for one more giant (∼20 kpc) Hα bubble in this system (see Appendix A). It may be part of the giant (∼40 kpc) expanding structure discussed by Greene et al. (2012). The possibility that this feature is an ionised gas shell, remnant of the galactic interactions, cannot be refuted.
Tidal dwarf galaxy (TDG) candidates have been identified as continuum and emission line compact objects at the tip of tidal tails in J0907+46, J1000+12, J0841+01, and J1356+10. The formation of these recycled objects in the debris of merging or interacting systems has been observed frequently and is predicted by simulations of colliding galaxies (e.g., Bournaud et al. 2004; Lelli et al. 2015).
4.3. Radio-optical alignment
We measured the degree of alignment between the ionised gas and the radio structures. To do so, we determined the relative angle between the radio and Hα axes. This study has been applied to the QSO2 in our sample with spatially resolved AGN related radio structures and available emission line GTC or HST images (Table 8), except J0853+38. This object has been excluded due to the complexity of both the optical and specially the radio morphologies, which results in the identification of multiple axes. The Teacup radio axes were measured in Harrison et al. (2015) via published radio maps and the radio and ionised gas axes for J1517+33 were measured in Fig. 9 of Rosario et al. (2010).
Degree of alignment ΔPA = |PArad − PAopt| between the Hα and radio axes.
To define the Hα axes, we only consider the gas at ≲30 kpc from the AGN. The gas beyond is in general associated with faint and distant tidal features (tails, bridges) and detached ionised patches, all located far from the radio structures and likely unrelated to them. The companion nucleus in J0841+01 has also been excluded in the Hα axis definition.
Both the ionised gas and radio morphologies are in general asymmetric and complex and several axes can be identified in both cases. The main Hα axes for objects with well-defined high surface-brightness features (e.g., bright clouds, collimated nebulae) were determined at both sides of the AGN by lines that start at the optical nucleus (expected approximate location of the AGN) and run across such features. The optical axes of objects with wide area, diffuse ionised gaseous structures (e.g., giant bubbles, amorphous halos, cones) were defined as the axes that start at the AGN location and bisect these regions. Only one axis is identified if there is gas detected on just one side of the optical nucleus.
To define the radio axes we followed a similar method. Axes were identified at one or both sides of the radio core, depending on the one or two sided radio morphology. All axes start at the core and extend up to bright compact radio features (e.g., hot spots) or along structures clearly elongated in a preferential direction. In the most complex cases, the radio source shows a preferential direction closer to the AGN and bends sharply further out (e.g., J0907+46 (Fig. 4) and J1000+12 (Fig. 6)). This means that more than one radio axis can be identified at one side of the radio core. The different radio and Hα axes are shown in Figs. 2–8 and their PA are in Table 8. The relative angles |PArad − PAopt| at each side of the AGN are also shown in this table.
We find that the radio and Hα axes are very closely aligned at both sides of the AGN in all objects (Table 8 and Fig. 11. Out of the 15 relative radio and optical angles measured, 11 form an angle |PArad − PAopt|< 10°. In the remaining 4 cases,  , which also imply close alignments. Such close alignments show that the Hα morphologies at < 30 kpc from the AGN and the radio morphologies are strongly shaped by AGN related processes.
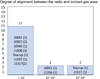 |
Fig. 11. Relative angles ΔPA = |PArad − PAopt| between the radio and ionised gas axes measured in the eight QSO2 indicated in this plot (see text). They have been grouped in three bins according to ΔPA < 10°, 10° ≤ΔPA < 20° and 20 ≤ ΔPA < 30°. For each object, the number of radio-Hα angles in that specific bin is shown in brackets. The radio and gas axes are in general very closely aligned. For seven objects (first bin), the axes are identical or almost identical (ΔPA < 10°) at least on one side of the AGN. |
4.4. Interactions between the radio source and the ambient gas
Nine out of thirteen QSO2 show evidence for interactions between the radio structures and the ambient gas on scales between ∼few kpc and 10s of kpc depending on the object. This conclusion is based both on our study and other authors work (see Appendix A for all relevant references).
These nine QSO2 show close morphological associations between emission line and radio features which suggest an interaction between the radio structures and the ionised gas on scales between several kpc and 10s of kpc from the nucleus (see Appendix A and Figs. 2–8): J0841+01, J0853+38, J0907+46, J0945+17, J1000+12, the Teacup, J1356+10, J1437+30, J1517+33. In these objects, line emission is enhanced near or at the location of radio features and sometimes tracing each other very closely. Spatially coincident signs of kinematic disturbance have been moreover identified in J0945+17, J1000+12, J1356+10, the Teacup, and J1517+33 (Rosario et al. 2010; Ramos Almeida et al. 2017; Jarvis et al. 2019).
Six of these objects show sharp radio bends at distances from several kpc up to 10s of kpc from the nucleus: J0853+38, J0907+46, J0945+15, J1010+12, J1356+17, and J1517+33. This on its own is probably an indication of an interaction with the gaseous environment, which abruptly alters the direction of the radio source. This is supported by the fact that in all cases but J0907+45, the bend is narrowly traced by the ionised gas morphology or occurs at locations where the gas presents distinct kinematics that deviates from the surrounding gaseous environment (Rosario et al. 2010; Jarvis et al. 2019).
Evidence of radio-gas interactions on scales of ≲2 kpc (equivalent to the radial size of the SDSS fibre) has been also reported in J0802+25, whose radio source is unresolved in our maps. Such evidence was based on the extreme kinematics and relatively strong line emission of the nuclear ionised outflow (Villar-Martín et al. 2014). Evidence for radio-gas interactions in J0948+25, J1108+06 and J1316+44 cannot be confirmed or refuted.
5. Discussion
5.1. Origin, properties, and frequency of the radio sources
As explained in Sect. 1, the frequency of jets and related structures (e.g., hot spots, lobes) in QSO2 and, more generally, non radio-loud quasars (RQ and RI) is unknown.
The z < 0.2 QSO2 sample studied here shows a high frequency of objects with spatially extended radio structures which are reminiscent of or, confirmed to be, AGN related. The sizes vary between 1-few kpc and up to almost 500 kpc (Sect. 4.1). Most extend well beyond the typical sizes of the spheroidal component of galaxies, sometimes well within the circumgalactic medium (CGM)4.
A high frequency for such structures was also found by Jarvis et al. (2019) in their sample of ten SDSS QSO2 at z < 0.2 (3 overlap with our sample). Most exhibit extended radio structures on 1–25 kpc scales that are consistent with being radio jets. They span log(L[OIII]/erg s−1) = 42.25−43.13 (log of the median 42.63) and log(P1.4) = 30.3−31.4 (median 31.1). The objects were selected to host nuclear ionised outflows (FWHM[OIII] ∼ 800−1800 km s−1). This is not likely to introduce a severe bias, given the high frequency of ionised outflows in QSO2 (Sect. 1), which, moreover, often show FWHM in this range (e.g., Villar-Martín et al. 2011, 2016; Mullaney et al. 2013; Harrison et al. 2014). On the other hand, we find that the detection of large-scale radio sources appears to be independent of the evidence and properties of nuclear ionised outflows (e.g., J0841+01 and J0853+38).
The detection of large-scale (≳10 kpc) AGN radio structures in RQQ is not frequent (Kellermann et al. 1994; Lal & Ho 2010; Zakamska et al. 2004; Villar-Martín et al. 2017), but observations have often been limited in sensitivity or resolution. The Beetle is an interesting object on this regard. While prior FIRST and NVSS radio information suggested that the radio emission is unresolved and consistent with star formation, deep VLA observations showed that it is associated with a ∼4 kpc jet and a large-scale (∼46 kpc) radio source (Villar-Martín et al. 2017), which is interacting with the galactic and circumgalactic environments across tens of kpc. Another interesting case is J0853+38. Our new observations have revealed a large and highly asymmetric radio source of total extension ∼3.5′ or ∼472 kpc (Appendix A).
It is not clear how these results fit in the general population of QSO2 since our sample and that of Jarvis et al. (2019) are affected by different sources of bias. They have relatively high radio luminosities, which favours the detection of AGN radio sources, compact or extended (see Sects. 1 and 2). In more than half of our sample there was prior solid or tentative evidence for the existence of extended radio sources. It is necessary to expand these studies to QSO2 samples of lower radio luminosities (Kellermann et al. 2016). We also selected objects with a rich and wide spread CGM which may increase the probability of detecting large-scale radio sources since the interaction with the ambient gas can enhance the radio emission, although, given the high incidence of merger and interaction signatures in QSO2 (70–75%; Bessiere et al. 2012; Urbano-Mayorgas et al. 2019), this criterion may not introduce a very restrictive bias.
5.2. Jet gas interactions
There is evidence for radio-gas interactions in 10 of the 13 z < 0.2 QSO2. In general, this is suggested by the close correlation between the radio and ionised gas morphologies (Sect. 4.4) and is supported in some cases by the associated turbulent gas kinematics described by other authors. Higher resolutions radio maps (e.g., J0802+25, J1437+30) and, most importantly, 2D spectroscopy would be very valuable to search for unambiguous signatures in some cases (e.g., correlations between the kinematic, physical and ionisation properties of the ionised gas and the radio morphology; Clark et al. 1998; Villar-Martín et al. 2017).
The radio-gas interactions have been identified across different spatial scales, from the inner NLR close to the AGN (≲1–2 kpc) up to tens of kpc, well outside the main body of the galaxies. The most extreme object on this regard is J0853+38, where the effect of the interaction is noticed across ∼58 kpc and up to at least 36 kpc from the AGN (Appendix A). Large-scale radio-gas interactions occur in objects with and without prominent nuclear outflows (e.g., J0841+01, J0853+38 do not host strong nuclear outflows). They can occur also in objects where the relative contribution of the radio to IR luminosity (i.e., q) is consistent with star formation (e.g., the Beetle; see Sect. 5).
Therefore, these radio sources provide a feedback mechanism that can act across different spatial scales from the nuclear region, and up to tens, even hundreds of kpc, across the ISM and well within the CGM (see also Villar-Martín et al. 2017; Jarvis et al. 2019).
The effects of the interactions are obvious both in the ambient gas and sometimes in the radio source, in the form of strong morphological distortions. Sharp deflections have been identified in J0853+39, J0907+46 and J1000+12 and possibly also J0841+01. These are the four largest radio sources (≥40 kpc) in our sample. Therefore, when the radio sources succeed at escaping out to large distances from the AGN, they appear deflected. In our sample, this can be a consequence of two things: on the one hand, the widely spread gas is an obstacle for the advance of the radio source. On the other hand, due to their modest radio power in comparison with powerful radio galaxies and radio loud quasars, the radio sources can be more easily deflected. One implication is that they can affect a larger volume and remain trapped for a longer time (Mukherjee et al. 2016).
Five QSO2 in our sample present firm or tentative evidence for giant bubbles of ionised gas (Sect. 4.2): J0841+01, J0945+17, J1356+10, J1000+06 and the Teacup. The sizes are similar ∼10 ± 2 kpc in all of them. In addition, a ∼20 kpc bubble candidate has been identified in J1356+10. One of the proposed mechanisms to inflate giant bubbles in galaxies are relativistic jets, both in active and non active galaxies, including the Milky Way (Zhang & Guo 2020). This mechanism has been proposed by Jarvis et al. (2019) for J1356+10, J1000+06 and the Teacup (see also Lansbury et al. 2018). Based on the morphological correlation with the radio emission, this may also the case in J0841+01 and J0945+17 although this cannot be confirmed with the available data (Appendix A).
5.3. Origin of the large-scale ionised gas
We found that QSO2 in interaction-merger systems are generally associated with ionised gas spread over tens of kpc well outside the main body of the galaxies (Sect. 4.2). A high fraction of these large-scale ionised features are a consequence of such interaction processes since they are morphologically related to tidal remnants. Given the high incidence of merger and interaction signatures in QSO2 (∼70–75%; Bessiere et al. 2012; Humphrey et al. 2015; Urbano-Mayorgas et al. 2019), these kind of features are expected to be very frequent in QSO2 overall.
These results are consistent with Stockton & MacKenty (1987), who found a correspondence between the incidence of strong extended ionised nebulae among QSO1 and the presence of overt signs of strong galactic interactions, such as close companion galaxies and continuum tails or bridges. This is also the case of powerful strong line radio galaxies. Recent results based on wide field integral field spectroscopy of 3C radio galaxies at z < 0.3 have revealed the widespread presence of filamentary ionised structures extending for tens of kpc (Balmaverde et al. 2018). The authors propose that they are likely the remnants of the gas-rich mergers which triggered the AGN. Different works show that indeed these type of systems tend to show strong evidence for mergers and interactions (Ramos Almeida et al. 2017; Tadhunter 2016).
Galactic interactions and mergers can spread the gaseous content of galaxies across huge volumes in the CGM. These remnants, which are generally detected in HI, can be rendered visible as a consequence of the nuclear activity. The intense and hard radiation from the QSO can ionise the gas up to many tens of kpc. Shocks driven during the interaction with large-scale radio structures can also contribute (Dopita & Sutherland 1995; Villar-Martín et al. 2017).
The close alignment between the axes of the ionised gas at < 30 kpc from the AGN and of the extended radio structures shows that the Hα morphology on these spatial scales and the radio morphology are strongly shaped by AGN related processes (Sect. 4.3). Other ionisation mechanisms unrelated to the nuclear activity must also be at work since some of the large-scale ionised features lie well outside the QSO2 ionisation cones (e.g., J0802+25, J0841+01, J0853+38, J1316+44, J1356+10, J1437+30, the Teacup; see also Balmaverde et al. 2018). The cone apertures can be approximately guessed by assuming the axis is roughly aligned with the radio axis and a half opening angle of ∼45°. Star formation, shocks induced by ram pressure, heat conduction, or magneto hydrodynamic waves are different possibilities (e.g., Boselli et al. 2016).
5.4. Limiting size of the NLR
Bennert et al. (2002) found that the size of the NLR in Seyfert galaxies and RQ QSO1 is proportional to the square root of L[OIII]. This, in turn, is a proxy of AGN luminosity (Heckman et al. 2004). Subsequent studies of SDSS QSO2 confirm this dependence and suggest that there is a maximal radial size of the NLR of RNLR ∼ 6−8 kpc beyond which the relation flattens (Hainline et al. 2014). The authors estimate this size using a cosmology-independent measurement, which is the radius where the SB corrected for cosmological dimming falls to SBmax = 10−15 erg s−1 cm−2 arcsec−2. They propose that beyond this distance there is either not enough gas or the gas is over-ionised and does not produce detectable [OIII]λ5007 emission. Other works suggest instead a smooth continuation of the size-luminosity relation out to large radii or a much larger break radius as previously proposed (e.g., Fischer et al. 2018; Husemann et al. 2019).
Different works, including our current study demonstrate that much larger (tens of kpc) reservoirs of ionised gas are frequently associated with AGN in the quasar regime. This includes radio loud and radio quiet, type 1 and type 2 quasars and strong line powerful radiogalaxies (Sect. 5.3; see also Villar-Martín et al. 2018). These features often have very low SB ∼few × 10−17 erg s−1 cm−2 arcsec−2. At the median redshift of the sample studied by Hainline et al. (2014) (z = 0.56), such features would have SB ∼ 10−17 erg s−1 cm−2 arcsec−2 taking into account cosmological dimming, which is ≪SBmax.
The high SB gas within RNLR most likely traces gas that has been photoionised by the AGN. Thus, in order to put our results in the context of these works, it would be necessary to determine the ionising mechanism of the large-scale gas and measure the maximum distance at which photoionisation by the QSO dominates the gas excitation. What is clear is that large-scale gas well beyond RNLR is abundant for many QSO2 (quasars in general), often having been dispersed in the CGM by merger or interactions (see also Storchi-Bergmann et al. 2018). On the other hand, gas photoionised by the quasar has been detected at tens of kpc from the AGN in several objects (e.g., Shopbell et al. 1999; Villar-Martín et al. 2010, 2018). It is clear that mapping gas with SB ≪ 10−15 erg s−1 cm−2 arcsec−2 is essential to tracing its true spatial distribution.
6. Summary and conclusions
In this work, we investigate the incidence of radio induced feedback in a sample of 13 optically selected SDSS QSO2 at z < 0.2, none of which are radio-loud. For this purpose, we searched for signs of radio-gas interactions by characterising and comparing the morphologies of the ionised gas and the radio structures. The first is traced by narrow band Hα images obtained with the GTC 10.4 m telescope and the Osiris instrument. The second is traced by VLA radio maps obtained with A and B configurations to achieve both a high resolution to study the galaxy environment as well as brightness sensitivity for imaging radio sources on tens to hundreds of kpc scales.
Our main conclusions are:
– The radio luminosity has an AGN component in 11 out of 13 QSO2. Such a component is spatially extended in 9 of them (jets, lobes, bubbles, other). Their relative contribution to the total radio luminosity at 1.4 GHz is in most cases in the range from 30% to 90%. The maximum sizes are in the range of  kpc to ∼500 kpc. Of special interest is the tentative detection of a 160 kpc radio source associated with the well known radio-quiet J1356+10 QSO2. In most cases, the radio source extends beyond the typical size of the spheroidal component of the galaxy and often well into the circumgalactic medium.
– QSO2 undergoing galaxy interaction-merger events appear to be invariably associated with ionised gas spread over large spatial scales, often well outside the main body of the galaxies. Given the high incidence of merger and interaction signatures in QSO2, this is expected to be frequent in QSO2 in general. The maximum distances from the AGN are in the range of rmax ∼ 12−90 kpc, with a median value of 46 kpc. The line luminosities are in the range of LHα = (2.5−235) × 1040 erg s−1. The nature is diverse including giant ionised bubbles, tidal features, giant (≳35 kpc) nebulae, tidal dwarf galaxy candidates, and distant patches at tens of kpc from the AGN.
– The axis of the ionised gas at < 30 kpc from the AGN and the axis of the extended radio structures are in general closely aligned at both sides of the AGN in the eight objects with available measurements. Seven objects show radio/Hα relative angles of < 10° at least on one side of the AGN. This shows that the Hα morphology on these spatial scales and the radio morphology are strongly shaped by AGN related processes.
– The detection of ionised gas at tens of kpc from the AGN in most of our sources puts into question the existence of a maximum size for the NLR ∼6–8 kpc. Mapping the ionised gas at surface brightness ≪10−15 erg s−1 cm−2 arcsec−2 is essential to characterise the true ionised gas distribution.
– Evidence of radio-gas interactions has been found in 10 out of 13 QSO2, that is, all but one of the QSO2 with confirmed AGN radio components. This conclusion is based both on the results of our study and of other authors. Therefore, when AGN radio sources are present, they tend to interact with the gaseous environment. The interactions occur across different spatial scales, from the scale of the nuclear NLR up to tens of kpc, well outside the main body of the galaxies. Thus, these radio sources provide a feedback mechanism that can act across different spatial scales from the nuclear region, and up to tens, even hundreds of kpc, across the ISM and well within the CGM (see also Villar-Martín et al. 2017; Jarvis et al. 2019).
– Large-scale (> 10 kpc) radio-gas interactions occur in objects with and without prominent nuclear ionised outflows.
– When the radio sources succeed at escaping out to large distances from the AGN (≳several kpc), they are frequently deflected. Therefore, the effects of the interactions are sometimes also obvious in the radio sources. The obstacle posed by the widely spread gas and the modest radio power in comparison with powerful radio galaxies and radio-loud quasars favour the deflection of the radio sources.
Although this sample cannot be considered representative of the general population of QSO2, it reinforces the idea that low to modest power, large spatial-scale radio sources can exist in radio-quiet QSO2 and provide a source of feedback on scales of the spheroidal component of galaxies and far beyond, well into the circumgalactic medium, in systems where radiative mode feedback is expected to dominate.
High-resolution, high-sensitivity radio observations and 2D wide-field integral field spectroscopy of larger QSO2 samples, especially with lower radio luminosities, will be very valuable for determining how frequently jets and related structures are present in the general population of non-radio loud quasars, as well as to constrain their sizes and morphologies and to evaluate their impact on the surrounding environment. Ultimately, this will provide deeper knowledge on the role of radio mode feedback in quasars overall.
This is based on the assumption that the non detections are close to the FIRST survey detection limit.
Some contamination by [NII]λλ6548,6583 is expected, although < 30%.
Following Tumlinson et al. (2017), we consider the CGM as the gas surrounding galaxies outside their disks or ISM and inside their virial radii.
The map shown in Fig. A.3 contains artefacts imprinted by the PSF near the bright radio core as a result of the snap-shot observations. We will mention only the features that are unambiguously real.
Acknowledgments
Based on observations made with the Gran Telescopio Canarias (GTC), installed in the Spanish Observatorio del Roque de los Muchachos of the Instituto de Astrofísica de Canarias, in the island of La Palma. Based also on data obtained with the Karl G. Jansky Very Large Array (VLA). The National Radio Astronomy Observatory is a facility of the National Science Foundation operated under cooperative agreement by Associated Universities, Inc. We have also used Hubble Space Telescope archive data. We thank the GTC staff for their support with the optical observations and the VLA staff for executing the radio observations. Thanks to Pieter van Dokkum and Philip Cigan for their useful advice on the optimum removal of cosmic rays of the HST images using the iraf task lacos_im.cl (van Dokkum 2001). MVM, AC, AAH and EB acknowledge support from grants AYA2016-79724-C4-1-P and PGC2018-094671-BI00 (MCIU/AEI/FEDER,UE). E. B. acknowledges the support from Comunidad de Madrid through the Atracción de Talento grant 2017-T1/TIC-5213. MVM, EB and AAH work was done under project No. MDM-2017-0737 Unidad de Excelencia ‘María de Maeztu’ Centro de Astrobiología (CSIC-INTA). AH was supported by Fundação para a Ciência e a Tecnologia (FCT) through the research grants UIDB/04434/2020 and UIDP/04434/2020, and an FCT-CAPES Transnational Cooperation Project. The National Radio Astronomy Observatory is a facility of the National Science Foundation operated under cooperative agreement by Associated Universities, Inc. This research has made use of: (1) the VizieR catalogue access tool, CDS, Strasbourg, France. The original description of the VizieR service was published in Ochsenbein et al. (2000); (2) data from Sloan Digital Sky Survey. Funding for the SDSS and SDSS-II has been provided by the Alfred P. Sloan Foundation, the Participating Institutions, the National Science Foundation, the US Department of Energy, the National Aeronautics and Space Administration, the Japanese Monbukagakusho, the Max Planck Society, and the Higher Education Funding Council for England. The SDSS Web Site is http://www.sdss.org/; (3) the Cosmology calculator by Wright (2006); (4) the NASA/IPAC Extragalactic Database (NED), which is operated by the Jet Propulsion Laboratory, California Institute of Technology, under contract with the National Aeronautics and Space Administration.
References
- Aalto, S., Falstad, N., Muller, S., et al. 2020, A&A, 640, A104 [EDP Sciences] [Google Scholar]
- Alatalo, K., Lacy, M., Lanz, L., et al. 2015, ApJ, 798, 31 [NASA ADS] [CrossRef] [Google Scholar]
- Baldi, R. D., Williams, D. R. A., McHardy, I. M., et al. 2018, MNRAS, 476, 3478 [NASA ADS] [CrossRef] [Google Scholar]
- Balmaverde, B., Capetti, A., Marconi, A., et al. 2018, A&A, 612, A19 [NASA ADS] [CrossRef] [EDP Sciences] [Google Scholar]
- Balmaverde, B., Capetti, A., Marconi, A., et al. 2021, A&A, 645, A12 [EDP Sciences] [Google Scholar]
- Baum, S. A., Zirbel, E. L., & O’Dea, C. P. 1995, ApJ, 451, 88 [NASA ADS] [CrossRef] [Google Scholar]
- Bellocchi, E., Villar Martín, M., Cabrera-Lavers, A., et al. 2019, A&A, 626, A89 [EDP Sciences] [Google Scholar]
- Bennert, N., Falcke, H., Schulz, H., et al. 2002, ApJ, 574, L105 [NASA ADS] [CrossRef] [Google Scholar]
- Bessiere, P. S., Tadhunter, C. N., Ramos Almeida, C., et al. 2012, MNRAS, 426, 276 [NASA ADS] [CrossRef] [Google Scholar]
- Best, P. N., Kauffmann, G., Heckman, T. M., et al. 2005, MNRAS, 362, 9 [NASA ADS] [CrossRef] [Google Scholar]
- Bondi, M., Pérez-Torres, M. A., Piconcelli, E., et al. 2016, A&A, 588, A102 [CrossRef] [EDP Sciences] [Google Scholar]
- Bonzini, M., Padovani, P., Mainieri, V., et al. 2013, MNRAS, 436, 3759 [NASA ADS] [CrossRef] [Google Scholar]
- Boselli, A., Cuillandre, J. C., Fossati, M., et al. 2016, A&A, 587, A68 [NASA ADS] [CrossRef] [EDP Sciences] [Google Scholar]
- Bournaud, F., Duc, P.-A., Amram, P., et al. 2004, A&A, 425, 813 [NASA ADS] [CrossRef] [EDP Sciences] [Google Scholar]
- Briggs, D. S. 1995, PhD Thesis, New Mexico Institute of Mining and Technology, USA [Google Scholar]
- Cabrera-Lavers, A., Bongiovanni, A., Cepa, J., & Rutten, R. G. M. 2014, Can. Obs. Updates, 1, 214 [Google Scholar]
- Clark, N. E., Axon, D. J., Tadhunter, C. N., et al. 1998, ApJ, 494, 546 [NASA ADS] [CrossRef] [Google Scholar]
- Comerford, J. M., Pooley, D., Barrows, R. S., et al. 2015, ApJ, 806, 219 [Google Scholar]
- Condon, J. J. 1992, ARA&A, 30, 575 [NASA ADS] [CrossRef] [MathSciNet] [Google Scholar]
- Condon, J. J., Kellermann, K. I., Kimball, A. E., et al. 2013, ApJ, 768, 37 [NASA ADS] [CrossRef] [Google Scholar]
- Dopita, M. A., & Sutherland, R. S. 1995, ApJ, 455, 468 [NASA ADS] [CrossRef] [Google Scholar]
- Duc, P.-A., & Renaud, F. 2013, Lecture Notes in Physics (Berlin: Springer Verlag), 327 [Google Scholar]
- Fabian, A. C. 2012, ARA&A, 50, 455 [Google Scholar]
- Fabian, A. C., Sanders, J. S., Allen, S. W., et al. 2011, MNRAS, 418, 2154 [NASA ADS] [CrossRef] [Google Scholar]
- Fanaroff, B. L., & Riley, J. M. 1974, MNRAS, 167, 31P [Google Scholar]
- Fischer, T. C., Kraemer, S. B., Schmitt, H. R., et al. 2018, ApJ, 856, 102 [NASA ADS] [CrossRef] [Google Scholar]
- Gagne, J. P., Crenshaw, D. M., Kraemer, S. B., et al. 2014, ApJ, 792, 72 [Google Scholar]
- Giacintucci, S., & Venturi, T. 2009, A&A, 505, 55 [NASA ADS] [CrossRef] [EDP Sciences] [Google Scholar]
- Greene, J. E., Zakamska, N. L., Ho, L. C., et al. 2011, ApJ, 732, 9 [NASA ADS] [CrossRef] [Google Scholar]
- Greene, J. E., Zakamska, N. L., & Smith, P. S. 2012, ApJ, 746, 86 [NASA ADS] [CrossRef] [Google Scholar]
- Hainline, K. N., Hickox, R. C., Greene, J. E., et al. 2014, ApJ, 787, 65 [NASA ADS] [CrossRef] [Google Scholar]
- Harrison, C. M., Alexander, D. M., Mullaney, J. R., et al. 2014, MNRAS, 441, 3306 [Google Scholar]
- Harrison, C. M., Thomson, A. P., Alexander, D. M., et al. 2015, ApJ, 800, 45 [NASA ADS] [CrossRef] [Google Scholar]
- Heckman, T. M., Kauffmann, G., Brinchmann, J., et al. 2004, ApJ, 613, 109 [NASA ADS] [CrossRef] [Google Scholar]
- Heesen, V., Croston, J. H., Harwood, J. J., et al. 2014, MNRAS, 439, 1364 [Google Scholar]
- Helou, G., Soifer, B. T., & Rowan-Robinson, M. 1985, ApJ, 298, L7 [Google Scholar]
- Herrera Ruiz, N., Middelberg, E., Norris, R. P., et al. 2016, A&A, 589, L2 [NASA ADS] [CrossRef] [EDP Sciences] [Google Scholar]
- Hodge, J. A., Becker, R. H., White, R. L., et al. 2008, AJ, 136, 1097 [Google Scholar]
- Humphrey, A., Villar-Martín, M., Ramos Almeida, C., et al. 2015, MNRAS, 454, 4452 [NASA ADS] [CrossRef] [Google Scholar]
- Husemann, B., Wisotzki, L., Sánchez, S. F., et al. 2013, A&A, 549, A43 [NASA ADS] [CrossRef] [EDP Sciences] [Google Scholar]
- Husemann, B., Bennert, V. N., Jahnke, K., et al. 2019, ApJ, 879, 75 [NASA ADS] [CrossRef] [Google Scholar]
- Issaoun, S., Johnson, M. D., Blackburn, L., et al. 2019, ApJ, 871, 30 [NASA ADS] [CrossRef] [Google Scholar]
- Jarvis, M. E., Harrison, C. M., Thomson, A. P., et al. 2019, MNRAS, 485, 2710 [NASA ADS] [CrossRef] [Google Scholar]
- Keel, W. C., Chojnowski, S. D., Bennert, V. N., et al. 2012, MNRAS, 420, 878 [NASA ADS] [CrossRef] [Google Scholar]
- Kellermann, K. I., Sramek, R. A., Schmidt, M., et al. 1994, AJ, 108, 1163 [NASA ADS] [CrossRef] [Google Scholar]
- Kellermann, K. I., Condon, J. J., Kimball, A. E., et al. 2016, ApJ, 831, 168 [NASA ADS] [CrossRef] [Google Scholar]
- Kimball, A. E., & Ivezić, Ž. 2008, AJ, 136, 684 [NASA ADS] [CrossRef] [Google Scholar]
- Kimball, A. E., Kellermann, K. I., Condon, J. J., et al. 2011, ApJ, 739, L29 [NASA ADS] [CrossRef] [Google Scholar]
- King, A., & Pounds, K. 2015, ARA&A, 53, 115 [NASA ADS] [CrossRef] [Google Scholar]
- Lal, D. V., & Ho, L. C. 2010, AJ, 139, 1089 [NASA ADS] [CrossRef] [Google Scholar]
- Lansbury, G. B., Jarvis, M. E., Harrison, C. M., et al. 2018, ApJ, 856, L1 [NASA ADS] [CrossRef] [Google Scholar]
- Leipski, C., Falcke, H., Bennert, N., et al. 2006, A&A, 455, 161 [NASA ADS] [CrossRef] [EDP Sciences] [Google Scholar]
- Lelli, F., Duc, P.-A., Brinks, E., et al. 2015, A&A, 584, A113 [NASA ADS] [CrossRef] [EDP Sciences] [Google Scholar]
- Liu, X., Greene, J. E., Shen, Y., et al. 2010, ApJ, 715, L30 [NASA ADS] [CrossRef] [Google Scholar]
- Maini, A., Prandoni, I., Norris, R. P., et al. 2016, A&A, 589, L3 [NASA ADS] [CrossRef] [EDP Sciences] [Google Scholar]
- Miley, G. K., Perola, G. C., van der Kruit, P. C., et al. 1972, Nature, 237, 269 [NASA ADS] [CrossRef] [Google Scholar]
- Mao, M. Y., Sharp, R., Saikia, D. J., et al. 2010, MNRAS, 406, 2578 [NASA ADS] [CrossRef] [Google Scholar]
- McMullin, J. P., Waters, B., Schiebel, D., Young, W., & Golap, K. 2007, ASP Conf. Ser., 376, 127 [Google Scholar]
- Molyneux, S. J., Harrison, C. M., & Jarvis, M. E. 2019, A&A, 631, A132G [Google Scholar]
- Mukherjee, D., Bicknell, G. V., Sutherland, R., et al. 2016, MNRAS, 461, 967 [NASA ADS] [CrossRef] [Google Scholar]
- Mullaney, J. R., Alexander, D. M., Fine, S., et al. 2013, MNRAS, 433, 622 [NASA ADS] [CrossRef] [Google Scholar]
- Müller-Sánchez, F., Nevin, R., Comerford, J. M., et al. 2018, Nature, 556, 345 [Google Scholar]
- Nardini, E., Wang, J., Fabbiano, G., et al. 2013, ApJ, 765, 141 [NASA ADS] [CrossRef] [Google Scholar]
- O’Brien, A. N., Norris, R. P., Tothill, N. F. H., et al. 2018, MNRAS, 481, 5247 [Google Scholar]
- Ochsenbein, F., Bauer, P., & Marcout, J. 2000, A&AS, 143, 23 [NASA ADS] [CrossRef] [EDP Sciences] [Google Scholar]
- Padovani, P., Miller, N., Kellermann, K. I., et al. 2011, ApJ, 740, 20 [NASA ADS] [CrossRef] [Google Scholar]
- Panessa, F., Baldi, R. D., Laor, A., et al. 2019, Nat. Astron., 3, 387 [NASA ADS] [CrossRef] [Google Scholar]
- Ramos Almeida, C., Piqueras López, J., Villar-Martín, M., et al. 2017, MNRAS, 470, 964 [NASA ADS] [CrossRef] [Google Scholar]
- Reyes, R., Zakamska, N. L., Strauss, M. A., et al. 2008, AJ, 136, 2373 [NASA ADS] [CrossRef] [Google Scholar]
- Rosario, D. J., Shields, G. A., Taylor, G. B., et al. 2010, ApJ, 716, 131 [Google Scholar]
- Ryle, M., & Windram, M. D. 1968, MNRAS, 138, 1 [NASA ADS] [Google Scholar]
- Shen, Y., Liu, X., Greene, J. E., et al. 2011, ApJ, 735, 48 [NASA ADS] [CrossRef] [Google Scholar]
- Shopbell, P. L., Veilleux, S., & Bland-Hawthorn, J. 1999, ApJ, 524, L83 [NASA ADS] [CrossRef] [Google Scholar]
- Stockton, A., & MacKenty, J. W. 1987, ApJ, 316, 584 [NASA ADS] [CrossRef] [Google Scholar]
- Storchi-Bergmann, T., Dall’Agnol de Oliveira, B., Longo Micchi, L. F., et al. 2018, ApJ, 868, 14 [NASA ADS] [CrossRef] [Google Scholar]
- Sun, A.-L., Greene, J. E., & Zakamska, N. L. 2017, ApJ, 835, 222 [NASA ADS] [CrossRef] [Google Scholar]
- Tadhunter, C. 2016, A&ARv, 24, 10 [NASA ADS] [CrossRef] [Google Scholar]
- Tadhunter, C., Morganti, R., Rose, M., et al. 2014, Nature, 511, 440 [NASA ADS] [CrossRef] [Google Scholar]
- Tingay, S. J., & Wayth, R. B. 2011, AJ, 141, 174 [Google Scholar]
- Tumlinson, J., Peeples, M. S., & Werk, J. K. 2017, ARA&A, 55, 389 [NASA ADS] [CrossRef] [Google Scholar]
- Urbano-Mayorgas, J. J., Villar Martín, M., Buitrago, F., et al. 2019, MNRAS, 483, 1829 [NASA ADS] [CrossRef] [Google Scholar]
- van Dokkum, P. G. 2001, PASP, 113, 1420 [NASA ADS] [CrossRef] [Google Scholar]
- Villar-Martín, M., Tadhunter, C., Pérez, E., et al. 2010, MNRAS, 407, L6 [NASA ADS] [CrossRef] [Google Scholar]
- Villar-Martín, M., Humphrey, A., Delgado, R. G., et al. 2011, MNRAS, 418, 2032 [NASA ADS] [CrossRef] [Google Scholar]
- Villar-Martín, M., Emonts, B., Humphrey, A., et al. 2014, MNRAS, 440, 3202 [NASA ADS] [CrossRef] [Google Scholar]
- Villar-Martín, M., Arribas, S., Emonts, B., et al. 2016, MNRAS, 460, 130 [NASA ADS] [CrossRef] [Google Scholar]
- Villar-Martín, M., Emonts, B., Cabrera Lavers, A., et al. 2017, MNRAS, 472, 4659 [NASA ADS] [CrossRef] [Google Scholar]
- Villar-Martín, M., Cabrera-Lavers, A., Humphrey, A., et al. 2018, MNRAS, 474, 2302 [NASA ADS] [CrossRef] [Google Scholar]
- Weilbacher, P. M., Duc, P.-A., & Fritze-v Alvensleben, U. 2003, A&A, 397, 545 [NASA ADS] [CrossRef] [EDP Sciences] [Google Scholar]
- Whittle, M. 1992, ApJS, 79, 49 [NASA ADS] [CrossRef] [Google Scholar]
- Wills, K. A., Morganti, R., Tadhunter, C. N., et al. 2004, MNRAS, 347, 771 [NASA ADS] [CrossRef] [Google Scholar]
- Wilson, A. S., & Ulvestad, J. S. 1983, ApJ, 275, 8 [NASA ADS] [CrossRef] [Google Scholar]
- Wright, E. L. 2006, PASP, 118, 1711 [NASA ADS] [CrossRef] [Google Scholar]
- Xu, C., Livio, M., & Baum, S. 1999, AJ, 118, 1169 [NASA ADS] [CrossRef] [Google Scholar]
- York, D. G., Adelman, J., Anderson, J. E., et al. 2000, AJ, 120, 1579 [CrossRef] [Google Scholar]
- Yoshida, M., Yagi, M., Ohyama, Y., et al. 2016, ApJ, 820, 48 [Google Scholar]
- Zakamska, N. L., & Greene, J. E. 2014, MNRAS, 442, 784 [Google Scholar]
- Zakamska, N. L., Strauss, M. A., Heckman, T. M., et al. 2004, AJ, 128, 1002 [NASA ADS] [CrossRef] [Google Scholar]
- Zakamska, N. L., Lampayan, K., Petric, A., et al. 2016, MNRAS, 455, 4191 [NASA ADS] [CrossRef] [Google Scholar]
- Zhang, R., & Guo, F. 2020, ApJ, 894, 117 [Google Scholar]
Appendix A: Results on individual objects
Here, we present detailed descriptions and results for the QSO2 in our VLA sample and the Teacup, grouped by radio source physical size. The main results regarding the sizes and nature of the radio structures and the large-scale ionised gas for all objects are summarised in Tables 5 and 6, respectively. They are complemented with results from other studies in the literature.
A.1. Large-scale radio sources (> 10 kpc from the AGN)
By ‘large’, we mean extended > 10 kpc from the AGN, which is significantly larger than the typical effective radius of the spheroidal component of QSO2 hosts (Urbano-Mayorgas et al. 2019). Thus, these sources may affect volumes as large as galaxy spheroids and beyond.
– J0841+01 (z = 0.110)
This dual or offset AGN system consists of two galaxies with distorted morphologies undergoing a major merger. They are separated by ∼4″ or 8 kpc (e.g., Greene et al. 2011; Comerford et al. 2015).
The GTC continuum and Hα images are presented in Fig. A.2. The interacting galaxies are clearly seen in both. The HST image obtained with the WFC3/UVIS and the F438W filter is also shown (central λ0 = 4320 Å and FWHM = 695 Å. Program 12754; PI J. Comerford). It includes the redshifted [OII]λ3727, which dominates the emission from the filamentary structures between the galaxies. The HST spatial resolution is essential to appreciate the shape and the morphological substructure of this gas. Storchi-Bergmann et al. (2018) proposed that this ionised gas delineates the ionisation cone of the QSO2 hosted by the eastern galaxy. Based on the edge-brightened appearance and the curved edges, we suggest that this gas traces a giant (∼8 kpc) ionised bubble inflated by an outflow driven by the QSO2.
The radio source of the RQ J0841+01 (Fig. 1) has a maximum extension of  or ∼40 kpc (Fig. A.1). We show in Fig. 2 the overlay between the low (B configuration, black contours) and high (A configuration, red contours) VLA radio maps with the Hα GTC and the [OIII]λ5007 continuum subtracted HST/ACS FR551N image from Storchi-Bergmann et al. (2018) (program 13741; PI: T. Storchi-Bergmann). Three compact radio components are identified: a radio core is associated with the QSO2 nucleus, a brighter radio knot is located between the two galaxies, overlapping with the intricate filamentary gas, and a third, outer knot overlaps with the northern side of the companion galaxy and is spatially shifted ∼2″ relative to its optical nucleus. This suggests that this third radio feature represents a hot-spot or lobe at the end of a jet associated with the QSO2.
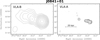 |
Fig. A.1. VLA radio maps of J0841+01. Left: B-configuration map. Contour levels start at 100 μJy beam−1 and increase by factor |


The middle radio component overlaps with the giant bubble candidate. Soft X-ray extended emission spatially coincident with this warm ionised gas has been detected (Comerford et al. 2015). This is reminiscent of the 10 kpc radio, X-ray and optical emission line bubble associated with the Teacup (Keel et al. 2012; Harrison et al. 2015; Lansbury et al. 2018). In this QSO2 it is not clear whether the bubble has been inflated by a wide angle AGN driven wind or by the relativistic radio source (see also Jarvis et al. 2019). The second scenario is favoured in J0841+01 by the similar size of the bubble and the triple radio source. The bubble could be ionised by the QSO2 (Storchi-Bergmann et al. 2018) or by shocks induced by the outflow (or both). The hot shocked gas may also produce the soft X-rays. Although projection effects cannot be refuted, the bubble seems to reach the western companion galaxy which may thus be also affected by the giant outflow. Spatially resolved spectroscopy would be essential to investigate this scenario further.
The large GTC collecting area allows to detect additional faint ionised gas spread over a large area beyond the main bodies of both galaxies (Fig. A.2, middle panel). The existence of ionised gas all over the place, including locations well outside the putative AGN ionisation cones, suggests that local excitation mechanisms unrelated to the AGN are at work at some positions.
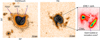 |
Fig. A.2. J0841+01. GTC continuum (left) and Hα images (middle). Contour values start at 3σ and increase with factor ×2. For the Hα image, σ = 4.1 × 10⁻¹⁹ erg−1 cm−2 pixel−1. QSO2 and C indicate the QSO2 and the companion galaxy. TDG is a tidal dwarf galaxy candidate (see text). The small right panel zooms in the central region of the HST WFC3/UVIS F438W image, which contains the [OII]λ3727 doublet. The intricate filamentary structures between the two galaxies are dominated by gas emission. They are reminiscent of a giant ionised bubble. In this and all figures the Hα images have been continuum subtracted. Also, N is always up and E is left. |
Hα emission is detected towards the NE up to a maximum distance rmax ∼ 21 kpc from the QSO2 and up to ∼14 kpc to the SW of the companion nucleus. The maximum distance between the detected ionised gas features is dmax ∼ 42 kpc. These structures are reminiscent of tidal features. Most show no or very faint identifiable continuum counterpart at the sensitivity of the GTC image. The Hα knot at the tip of eastern tail is an exception. The spatial location, the compact morphology and the relatively strong continuum emission suggest that it is a tidal dwarf galaxy (TDG; e.g., Bournaud et al. 2004). An alternative scenario is also possible. Several radio knots seem to track the eastern Hα tail (Fig. A.2). The advancing radio jet may be interacting with the ambient gas along the tail possibly enhancing its Hα emission. At the same time, the jet is being deflected by the gas.
No evidence for an ionised outflow has been identified in this object (see also Greene et al. 2011). The non detection of the outflow may be a consequence of the dilution due to the large size of the 3″ SDSS fibre.
– J0853+38 (z = 0.127)
This RI QSO2 (Fig. 1) has a remarkable radio morphology (Fig. A.3)5. The high resolution (VLA A-configuration) map shows a radio core and two narrow jets extending N (∼4.5 kpc) and S (∼9.0 kpc) of the AGN. Beyond a gap in the radio emission, the high SB jet bends sharply and extends towards the east for ∼60 kpc. This jet was already apparent in the FIRST data. The VLA B-configuration map reveals that it is part of a much larger and highly asymmetric radio source of total extension ∼3.5′ or ∼472 kpc. The bent jet extends towards the NE with a wiggling morphology that ends in a hot spot at ∼1.5′ or ∼202 kpc from the QSO2. This is embedded in a large lobe, which shows diffuse emission mostly on the northern side along the jet and hot-spot.
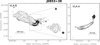 |
Fig. A.3. VLA radio maps of J0853+38. Same as Fig. A.1. Contour levels start at 60 μJy beam−1 (B-configuration) and 100 μJy beam−1 (A-configuration) and increase with factor |

Towards the SW, another radio lobe with no identifiable hot spot is detected at similar distance from the QSO2. The northern ∼4.5 kpc inner jet detected in the A configuration map appears to bend 90° towards the west in the B configuration image. Faint radio emission detected between this structure and the SW lobe suggests that the radio lobe may be continuous, as on the eastern side, but Doppler de-boosted and thus receding. The low SB radio emission fills an area of at least ∼20 000 kpc2 in projection. Therefore, the relativistic electrons have the potential to inject energy across a huge volume and large distances from the AGN.
The GTC images of J0853+38 are shown in Fig. A.4. The QSO2 host is a spiral galaxy and so is SDSS J085317.82+385311.7 at ∼37.5″ (84 kpc) to the NW (zph = 0.123 ± 0.010; SDSS database). The Hα image shows the spiral arms of this companion prominently. This is not detected in the VLA maps. Both galaxies may be interacting, although this is not conclusive based on our data.
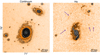 |
Fig. A.4. J0853+38. GTC continuum and Hα images. Contour values start at 3σ and increase with factor ×2. For the Hα image, σ = 3.4 × 10⁻¹⁹ erg−1 cm−2 pixel−1. The purple arrows in the right panel mark distant patches of Hα emission. |
The Hα image shows extended ionised gas all around the QSO2 nucleus. Some of it overlaps with the spiral arms and is naturally explained by star formation. This is further supported by the presence of some compact regions on the eastern side.
The most prominent ionised features extend up to ∼36 kpc N and ∼22 kpc S of the AGN. They are not tightly correlated with the spiral arms and the main axis is misaligned relative to the continuum major galaxy axis (Fig. A.4, right).
The overlay between the low (B configuration) and high (A configuration) VLA radio maps with the Hα GTC image is shown in Fig. 3. Both N and S of the QSO2, the ionised gas and the radio source trace each other. The prominent bends of the radio source suggest that it is propagating through a gas rich environment that deflects it (Heesen et al. 2014). Simultaneously the radio source appears to be affecting the Hα morphology by redistributing or exciting the gas it encounters as it advances.
There is a gap of Hα emission at ∼10 kpc south of the AGN. The southern radio structure bends at or near this location. This morphological correlation suggest that the radio source has cleared this region of gas. At the same time, this interaction forces it to change its trajectory.
Therefore, the J0853+38 radio source is interacting with the ambient gas at different locations up to at least ∼36 kpc from the AGN. In fact, the radio source is so large that it has the potential to affect a huge volume in and around the QSO2 host.
Several patches of Hα emission indicated with purple arrows in the middle panel of Fig. A.4 are seen at different locations at tens of kpc from the QSO2 and the companion (rmax ∼ 31″ or 70 kpc and dmax ∼ 100 kpc). They may be separate gas patches, but it appears more probable that they are fragments of a much larger probably neutral gas reservoir made of tidal remnants from the interaction between both galaxies. Local ionisation by star formation or other mechanisms could produce Hα at these particular locations.
As in J0841+01, there is no conclusive evidence for an ionised outflow in the NLR of SDSS J0853+38 as traced by [OIII]. The lines in the SDSS spectrum are best reproduced by two narrow components with FWHM = 155 ± 10 and 129 ± 12 km s−1 respectively, shifted by 213 ± 10 km s−1. A faint blue excess asymmetry is detected which may be the signature of a faint outflow, but the kinematic properties are too uncertain. A possible fit is shown in Fig. A.5. The broadest component contributes ∼16% of the total line flux. It has a FWHM = 948 ± 70 km s−1 and similar velocity as the faintest narrow component.
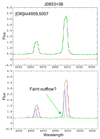 |
Fig. A.5. [OIII] doublet SDSS spectrum of J0853+38. Wavelength in Å. A fit (green) and residuals (red) are shown in the top panel with the data (black). The three kinematic components isolated in the fit are shown in the bottom panel with different colours. The broadest component may trace an ionised outflow, but higher S/N data is needed to confirm this. Wavelength in Å. Fluxes in units of 10−15 erg s−1 cm−2 Å−1. |
Therefore, radio induced feedback can work across giant spatial scales also in objects with no or faint nuclear outflows.
– J0907+46 (z = 0.167)
Little is known about this RI QSO2 (Fig. 1). The FIRST radio image shows an extended source (∼20″ or 57 kpc) which is appreciated with greater detail in our VLA data (Fig. A.6). It is a complex, highly asymmetric source of total size  kpc. The radio emission is extended near the radio core for ∼13 kpc along PA ∼ 29°. At both ends the inner radio jet bends towards the W. On the southern edge, it bends almost ∼90°. It extends for ∼20 kpc more where it bends again and extends further up to ∼48 kpc. To the east, some low SB emission is detected up to ∼14 kpc from the AGN.
 |
Fig. A.6. VLA radio maps of J0907+46. Same as Fig. A.1. Contour levels start at 200 μJy beam−1 (B-configuration) and 80 μJy beam−1 (A-configuration) and increase with factor of |

We show in Fig. A.7 the GTC continuum and Hα images. The QSO2 host is an almost circular galaxy with no apparent signs of mergers or interactions in the continuum image. The Hα emission in the host galaxy is elongated along PA ∼ 29° (as with the radio axis PA) with a total size of ∼31 kpc. It is strongly misaligned relative to the continuum morphology. Low SB emission extends further out up to 24 kpc from the AGN to the SW. In addition, a long (∼44 kpc) Hα filament extends from the northern side of the galaxy towards the east. It is reminiscent of a tidal tail, although no signs of morphological disturbance are apparent in the continuum image. The filament ends up precisely at the location of a small continuum source which may be a TDG at the tip of the tidal tail (e.g., Bournaud et al. 2004). It is located at rmax ∼ 46 kpc from the galaxy nucleus.
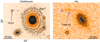 |
Fig. A.7. J0907+46. GTC continuum and Hα images. GTC continuum and Hα images. Contour values start at 3σ and increase with factor ×2. For the Hα image, σ = 2.4 × 10⁻¹⁹ erg−1 cm−2 pixel−1. The purple arrows in the right panel mark distant patches of Hα emission. The contours highlight the different shape of the continuum and Hα isophotes. The small continuum source in the left panel is a tidal dwarf galaxy (TDG) candidate. Its location in the Hα image is shown with a small circle. |
We show in Fig. 4 the GTC Hα image of J0907+46 with overlaid contours of the VLA A (red) and B-configuration (grey) data. The Hα morphology and the inner radio structures are aligned and have similar extensions (∼13 kpc). At the edges of the brightest Hα emission the radio source appears to bend sharply. This suggest that the radio source and the ambient gas are interacting. This may cause the deflection of the radio source.
An [OIII] outflow is isolated in the SDSS spectrum with FWHM = 1095 ± 97 km s−1 and blueshifted by −110 ± 40 km s−1 relative to the narrow core of the line. It contributes ∼19% of the total [OIII] flux (Fig. A.8).
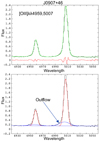 |
Fig. A.8. [OIII] doublet SDSS spectrum of J0907+46. Panels and line colour code as in Fig. A.5. The broadest of the two kinematic components isolated in the fit traces an ionised outflow (blue, bottom panel). Wavelength in Å. Fluxes in units of 10−15 erg s−1 cm−2 Å−1. |
– J0945+17 (z = 0.128)
This RQ/RI QSO2 (Fig. 1) shows an excess of radio emission above that expected from star formation (q = 1.35 ± 0.10; Sect. 2). The new VLA maps are shown in Fig. A.9.
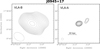 |
Fig. A.9. VLA radio maps of J0945+17. Same as Fig. A.1. Contour levels start at 500 μJy beam−1 and increase with factor |

No GTC images are available for this object. The HST WFPC2 F814W continuum image (program 6346; PI K.D. Borne) shows signatures of galactic interactions (Fig. A.10). The host galaxy is morphologically distorted and has a ∼56 kpc long tidal tail stretching towards the W.
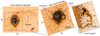 |
Fig. A.10. J0945+17. Left: HST WFPC F814W continuum image. This filter covers the spectral range of 7617–8921 Å (6752–7909 Å rest frame) and is thus dominated by continuum. Middle panel: HST ACS /WFC FR716N image containing Hα+[NII] (the images are not flux calibrated). It has been rotated to show N up and E left. The contours start at 3σ and increase with a factor ×2 (continuum image) and ×3 (narrow band image). The region of the cloud and the giant bubble candidate is zoomed in the right panel. The extended filamentary structures are dominated by line emission. The ‘cloud’ at ∼11 kpc to the west was identified by Storchi-Bergmann et al. (2018). It is part of a spectacular ensemble of ionised filaments whose morphology is reminiscent of a giant bubble. |
Jarvis et al. (2019) presented 1–7 GHz high (0.22″ × 0.21″ beam) and low-resolution (∼1.2″ × 0.9″ beam) radio imaging (VLA and e-MERLIN) of this QSO2. The VLA map shows two spatially distinct features. One overlaps with the QSO2 host (LR:A, using their nomenclature) and a separate component at ∼5″ or ∼11 kpc to the NW (LR:B), which they identify with a secondary jet or lobe. LR:A is resolved with e-MERLIN, into a compact core associated with the QSO2 nucleus and a ∼1″ (∼2.3 kpc) curved feature, possibly a bent jet. It terminates at a region of brightened blueshifted [OIII] emission. They propose that the jet is hitting a cloud, both pushing the gas away and deflecting the jet.
Further indirect evidence that this small jet is triggering a nuclear ionised outflow is provided by the SDSS spectrum (Fig. A.11). A strong outflow with FWHM ∼ 1935 ± 35 km s−1 and blueshifted by Vs = −252 ± 18 km s−1 is identified in the [OIII] lines. The large values of the ratios ![Mathematical equation: $ R=\frac{{FWHM}_\mathrm{[OIII]^{\mathrm{outflow}}}}{{FWHM}_{\mathrm{core}}} =5.9 \pm 0.3 $](/articles/aa/full_html/2021/06/aa39642-20/aa39642-20-eq42.gif) (this is, the FWHM of the outflow component compared with the FWHM of the narrow line core) and
(this is, the FWHM of the outflow component compared with the FWHM of the narrow line core) and  (ratio between the flux of the broad component and the total Hβ flux) suggest that this outflow is triggered by a radio source (Villar-Martín et al. 2014).
 |
Fig. A.11. [OIII] doublet SDSS spectrum of J0945+17. Panels and line colour code as in Fig. A.5. The broadest of the three kinematic components isolated in the fit traces a prominent ionised outflow (blue, bottom panel). Wavelength in Å. Fluxes in units of 10−14 erg s−1 cm−2 Å−1. |
Our new VLA A and B configuration maps (Fig. A.9) were obtained with texp = 30 and 60 min on source respectively (prior radio maps were obtained with 5–10 min exposure). The two radio components are LR:A and LR:B in Jarvis et al. (2019). LR:B overlaps with a region of ionised gas that was studied by Storchi-Bergmann et al. (2018) using narrow-band [OIII] and Hα+[NII] HST images. They describe a ‘cloud’ of ionised gas that could be either reminiscent of a merger or interaction or due to a previous outflow from the AGN.
Although our radio maps do not reveal additional structures, novel results are obtained from the comparison with the HST images. The ACS F716N image containing Hα+[NII] (see Storchi-Bergmann et al. 2018 for details). Program 13741; PI: T. Storchi-Bergmann is shown in Fig. A.10 with the continuum image. We also show in Fig. 5 the overlay of the VLA A and B configuration maps and the HST/WFC FR551 image containing [OIII]λ5007 (same HST program).
The ‘cloud’ is detected in both the line and the continuum images. It may be a small galaxy that has been hit by the jet. The elongated morphology of LR:B is tightly correlated with a clear enhancement of the line emission in two knots that are part of the ‘cloud’ (see also Fig. A.10). We refute the possibility that the line and radio emissions are produced locally by star formation. The 1.4 GHz luminosity of LR:B is log(P1.4 GHz) = 30.46 in erg s−1. The implied star forming rate would be 109 M⊙ yr−1 (Condon 1992; Hodge et al. 2008) which in turn would result on an unrealistically high LHα ∼ 1.4 × 1043 erg s−1. This is ∼125 times higher than that roughly inferred from the Hα+[NII] HST image, accounting for the continuum and ignoring [NII] contamination. Given the morphology and high SB of the ‘cloud’, it appears unlikely that reddening could explain this discrepancy.
We propose a different scenario. The ‘cloud’ is part of a spectacular filamentary structure whose morphology is reminiscent of a giant ∼10 kpc bubble (see right panel in Fig. A.10). It may be a giant outflow, which has been inflated by a wide angle AGN driven wind or by the radio source. The emission is enhanced in the ‘cloud’, because the LR:B jet or lobe has hit the bubble at this location. The ‘cloud’ appears to be deflecting the radio source as well. The radio axis and the main bubble axis are misaligned by ∼30°. This could be a consequence of jet precession and multiple episodes of jet activity (Jarvis et al. 2019). There are two very narrow ionised filaments of lengths ∼18 and 4 kpc to the east. It is unclear whether they trace the edge of a counter-bubble at the opposite side of the AGN.
– J1000+12 (z = 0.148)
This RQ/I QSO2 shows a clear excess of radio emission (q = 1.08 ± 0.09) relative to that expected from star formation (Fig. 1). A [OIII] outflow is identified in the SDSS spectrum with FWHM = 1069 ± 19 km s−1 blueshifted by Vsfv = −63 ± 10 km s−1 (see also Sun et al. 2017).
J1000+12 was also part of Jarvis et al. (2019) sample. They observed it with the VLA from 1−8 GHz with resolution ranging from 0.3−4.8″ and exposure time of 5–7 min per target. In addition, they obtained deep e-MERLIN observations at 1.4 GHz. They identified large-scale radio emission over ∼25 kpc divided into four components. Using their nomenclature, these are LR:A (which encompasses core and jet) and three lobes (LR:B, LR:C and LR:D), which trace a strongly bent morphology that is likely a sign of deflection. The high-resolution map shows a ∼1″ (∼2.6 kpc) jet-like structure to the S of the radio core and a hot spot at ∼6.4 kpc to the N.
The authors compare the spatial distribution of the radio and [OIII] morphologies. Both morphologies and the gas kinematics are complex. [OIII] is enhanced along the probable southern jet. They propose that the line splitting and blue asymmetry at its base is a signature of a ∼10 kpc outflowing bubble being launched by the jet.
We show in Fig. A.12 our VLA maps of J1000+12, which have 6−11× longer integration times than the observations by Jarvis et al. (2019). The B-configuration map does not reveal radio structures on significantly larger scales than previously identified. Several faint knots are detected in the A-configuration image that prolong the LR:C SE lobe in Jarvis et al. (2019) towards the east. We measure a maximum extension of the radio source of  kpc.
kpc.
 |
Fig. A.12. VLA radio maps of J1000+12. Same as Fig. A.1. Contour levels start at 150 μJy beam−1 (B-configuration) and 93 μJy beam−1 (A-configuration) and increase with factor |

We show in Fig. A.13 the GTC continuum and Hα images of J1000+12. Both show a highly distorted morphology due to a merger or interaction event. The large galaxy to the SE is most likely unrelated to the QSO2. The SDSS photometric redshift zph = 0.06 ± 0.02 is significantly lower than that of the QSO2. The non-detection in the Hα image further supports a different z.
 |
Fig. A.13. J1000+12. GTC continuum and Hα images. Contour values start at 3σ and increase with factor of two or three for the continuum and Hα images, respectively. For the Hα image, σ = 3.8 × 10⁻¹⁹ erg−1 cm−2 pixel−1. Right panel: Hα emission in a smaller region centred on the QSO2 with a different colour palette. The small green * symbol in the middle panel shows the expected location of the TDG candidate identified in the continuum image. Several additional features mentioned in the text are indicated with purple arrows. |
 |
Fig. A.14. VLA radio maps of J1356+10. Same as Fig. A.1. Contour levels for the B-configuration data start at 3.5, 4.5, 5.5σ and then increase in steps of |


A long tidal tail extends from the QSO2 host towards the south for at least ∼72 kpc. It ends at the location of a small continuum source which may be a tidal dwarf galaxy (see also J0841+01, J0907+46 and J1356+10).
The Hα image shows a complex gaseous environment extending for tens of kpc. The tidal tail is clearly seen. It shows a gap at ∼50 kpc which is not apparent in the continuum image (Fig. A.13). Beyond, this gap the line emission becomes more diffuse and ends at the expected location of the TDG candidate identified in the continuum image (Fig. A.13, middle panel). The patch of low SB Hα emission detected further out, at ∼90 kpc from the QSO2 nucleus is probably a ghost, since it is seen only in one of the tunable filter frames.
The Hα and radio overlay is shown in Fig. 6. The overlay between the radio map and the HST/WFC3/UVIS2 FQ508N filter image containing [OIII]λ5007 (program 4730; PI A. Goulding) is also shown in the small panel. We adopt Jarvis et al. (2019) nomenclature to identify the main radio structures. The ionised gas and radio morphologies are clearly correlated across large spatial scales (see also Jarvis et al. 2019), which suggests that they are interacting. The brightest Hα and radio features overlap spatially. The long and narrow, jet-like Hα feature extending ∼9 kpc towards the north from the AGN overlaps with LR:B (see also Fig. A.13, right panel). The velocity of this gas is blueshifted relative to the adjacent gas and the nuclear emission, which is additional evidence for the interaction (Jarvis et al. 2019). Further out, the ionised gas traces the bend of the LR:D radio lobe. Moreover, the Hα blob ∼10 kpc SW of the AGN, overlaps with the location of the highest LR:C radio lobe flux.
We note that none of the above ionised features overlap with the ∼10 kpc giant, jet-driven outflowing bubble hypothesised by Jarvis et al. (2019) based on the [OIII] high positive asymmetry and splitting of the line profile. Its location is indicated in Fig. 6. It overlaps partially with a narrow radio extension, but this is most likely an artefact of our snap-shot observations (see Fig. A.12).
– J1356+10 (z = 0.123)
This RQ/RI QSO2 (Fig. 1) has been widely studied for two main reasons: it is a dual AGN candidate and it hosts a giant ionised outflow candidate. Greene et al. (2011) identified a pair of giant (∼12 kpc) expanding shells or bubbles centred on the northern nucleus, which hosts the QSO2. They propose that these are part of a larger expanding structure of total size ∼40 kpc (see also Shen et al. 2011; Comerford et al. 2015).
The origin of the outflow is unclear. It may have been driven by the quasar radiation (Greene et al. 2011) or by a radio jet (Jarvis et al. 2019). These authors identified an elongated, bent radio source, possibly a jet, extending ∼5–6 kpc from the QSO2 nucleus that ends at the base of the southern bubble. It overlaps with a region of turbulent ionised gas, possibly induced by its interaction with the radio source. They propose that jet induced outflows have inflated the bubble.
We show in Fig. A.15 the GTC continuum and Hα images of J1356+10. There is a high density of galaxies at ≲1′ from the QSO2 compared with neighbouring sky areas. G1, at 26″ (57 kpc) to the N, is an interacting companion connected by a tidal feature to the central merging system (Greene et al. 2012). G3 and G4, and maybe also G2, G5, and G6, belong to the same group. G3 is a disk galaxy with SDSS photometric zph = 0.143 ± 0.026 (consistent with the QSO2). All attempts to subtract the continuum from the TF image leave similar Hα residuals tracing the nucleus and the edge-on disk (Fig. A.15, middle panel). Although G4 and G5 have higher zph = 0.176 ± 0.034 and 0.379 ± 0.148, the residual Hα emission from both suggests a similar z as J1356+10. According to the SDSS database, G2 and G6 have zph consistent with the QSO2. No reliable Hα residuals are detected and, thus, the z cannot be confirmed with our data.
 |
Fig. A.15. J1356+10. GTC continuum and Hα images. Contour levels in the continuum (first panel) and Hα images (second panel) start at 3σ and increase with factor ×2.5. For the Hα image, σ = 4.4 × 10⁻¹⁹ erg s−1 cm−2 pixel−1. Galaxies G1, G3, G4 and possibly G2, G5, and G6 are members of the same group as the QSO2 (see text). The rectangular areas in the second panel are zoomed in the 3th (top rectangle) and 4th (bottom rectangle) panels. The contours in these trace the morphology within the high SB regions. The purple arrows in the last panel show the location of the giant 12 kpc bubble, the clumps and wisps identified by Greene et al. (2012). Additional faint Hα features are also indicated. Ionised gas is detected up to ∼16 kpc to the east and west of the long tidal filament (third panel). |
The continuum image (Fig. A.15, left panel) shows the well-known highly disturbed morphology of the system. Continuum is detected across large spatial scales centred on the QSO2 and the companion nucleus, with a maximum extension in the SE-NW direction of ∼92 kpc. It traces stellar material that has been spread during the merger over a large volume.
The long Hα filament extending up to 42″ or ∼92 kpc N of the QSO2 was discovered by Greene et al. (2012) with long slit spectroscopy. It seems to connect the QSO2 host with G1, and extends further out up to ∼32 beyond this small galaxy. Line emission from G1 cannot be confirmed. There is a faint elongated continuum feature on its northern side which may be a tidal remnant of the interaction with the QSO2 host.
The tidal filament is invisible in the continuum image and ends on a bright separate Hα knot. The compact morphology and the spatial location at the tip of the filament suggest that it is a TDG (see also and J0841+01, J0907+46 and J1000+12). Very faint Hα extensions are detected up to ∼16 kpc to the east and west of the filament in the direction perpendicular to it (third panel of Fig. A.15).
J1356+10 is also associated with a large, morphologically disturbed reservoir of ionised gas which is widely spread around the central nuclei and overlaps partially with the amorphous continuum halo. The deep GTC image shows that it extends up to ∼37 kpc from the QSO2 nucleus to the SE and across a maximum extension of ∼70 kpc in the SE-NW direction. Part of this reservoir was traced across 40 kpc along PA 45° with long slit spectroscopy by Greene et al. (2012). The giant 12 kpc bubble candidate, wisps and northern clumps identified by these authors are indicated in Fig. A.15 (right panel) (see also Jarvis et al. 2019).
We highlight in Fig. A.15 (right panel) a remarkable feature with no continuum counterpart which is reminiscent of an edge brightened ∼20 kpc bubble. It may be part of the giant ∼40 kpc hypothetical expanding structure mentioned above. Considering also the southern ∼12 kpc jet-driven bubble candidate, multiple outbursts driven by different mechanisms are suggested. 2D spectroscopy would be essential to investigate this further, by characterising the kinematics and ionisation mechanism across the entire system.
The messy Hα morphology is reminiscent of the triple SMBH merger system NGC 6240 (z = 0.024; Yoshida et al. 2016; Müller-Sánchez et al. 2018). Hα is detected across dmax ∼ 92 kpc and shows multiples loops, bubbles, knots, and filaments. The complex nebular morphology and kinematics have been proposed to be a combination of a double outflow (one AGN driven and one starburst driven) and the merger (Nardini et al. 2013). A similar scenario of multiple outflows and a complex merger may apply to J1356+10.
The VLA A and B-configuration maps of J1356+44 are shown in Fig. A.14 (see also Fig. 7). The ∼5 kpc southern extension seen in the high resolution map was interpreted as a radio jet or lobe by Jarvis et al. (2019). It coincides with a gap in Hα (small panel in Fig. 7). Our B-configuration map (Fig. A.14, left) reveals emission on scales of ∼160 kpc. It is reminiscent of the brightest regions of two diffuse radio lobes with PA axis ∼22°, which coincides with the PA of the inner jet or lobe. The emission in the outer lobes of J1356+10 is very faint, and the original data was plagued by image artefacts, therefore, additional DDT time was granted to verify this large-scale emission (Sect. 3.2). Our combined B-configuration data shows persistent large-scale radio emission at a level of 4−5σ level. Nevertheless, future synthesis observations are needed to unambiguously confirm and accurately image this extended emission in J1356+10.
Assuming that the large-scale radio source is real, it would mean that the radio structures have escaped the QSO2 host and have advanced a huge distance of ∼80 kpc, well within the CGM. This radio source would have the potential to provide a feedback mechanism that may affect the properties of the rich, complex environment across ∼160 kpc (Villar-Martín et al. 2017).
– The Teacup (z = 0.085)
This RQ QSO2 (Fig. 1) has been widely studied. The system hosts a giant outflow whose effects are noticed up to ∼10–12 kpc from the AGN and is responsible for the bubble-like morphology of the ionised gas and diffuse radio emission (Keel et al. 2012; Gagne et al. 2014; Ramos Almeida et al. 2017; Harrison et al. 2015). The outflow may have been generated by a wide angle AGN driven wind or by the ∼1 kpc radio jet. The almost coincident direction of the central (∼1 kpc) ionised outflow and the radio axis suggests that the radio jet has triggered the nuclear outflow at least (Ramos Almeida et al. 2017; Jarvis et al. 2019).
Based on long slit GTC spectroscopy at PA 60° and 90°, Villar-Martín et al. (2018) reported the discovery of a ∼100 kpc ionised nebula associated with this object. We proposed that it is part of the CGM of the QSO2 host, which has been populated with tidal debris by galactic interactions and rendered visible thanks to the illumination by the AGN. The optical and radio bubbles appear to be expanding across this medium.
We included the Teacup in our GTC (but not VLA) sample with the aim of mapping the morphology of the giant nebula. The optimum scaling factor for the continuum image that produces the best subtraction for most sources in the field is not adequate for the Teacup host. Strong negative residuals remain at the location of large-scale diffuse continuum features associated with the galaxy. Thus, the scaling factor underestimates the continuum level. Since no prominent emission lines contaminate the continuum filter, the spectrum in those areas must be quite steep. This is supported by the SDSS spectrum, which reveals the bluest spectrum among all QSO2 in our sample. We thus scale the continuum and TF images to produce the best subtraction of all the Teacup continuum features. The results are shown in Fig. A.16.
 |
Fig. A.16. Teacup. Continuum (left) and Hα images with two different contrasts (middle and right panels) to highlight individual features and the giant low surface brightness halo (right). Contour values start at 3σ and increase with factor ×3 for the Hα image (σ = 3.2 × 10⁻¹⁹ erg−1 cm−2 pixel−1) and ×1.5 for the continuum image. The contours in the middle panel are shown to identify the well known ionised bubbles. The different features marked on the right panel are discussed in the text. The black circles enclose distant Hα patches. |
Faint Hα emission is detected across a huge area of total extension 115 kpc × 87 kpc (the major and minor axes, respectively). The surface brightness is (0.5–few) × 10−17 erg s−1 cm−2 arcsec−2. It is bordered towards the NE by an arc with vertex at ∼56 kpc from the QSO2 (see third panel in the figure). The NE arc and the nebula have a similar main axis as the bubble and the radio jet (Harrison et al. 2015). This suggests that the nebular morphology is influenced on very large scales by the nuclear activity. The total luminosity of te nebula is LHα = (4.1 ± 0.3) × 1041 erg s−1. This does not include the contribution of the ∼10 kpc ionised bubbles, which have (4.0 ± 0.2) and (2.8 ± 0.5) × 1041 erg s−1 for the NE and SW bubbles respectively.
Our long slit spectroscopy showed line emission all the way from the QSO2 up to the NE arc and not beyond. The projected area within the arc therefore appears to be filled with gas (Villar-Martín et al. 2018), but the SB is significantly lower (Fig. A.16). Altogether, it appears that the NE arc encompasses an edge brightened cavity.
Several additional diffuse Hα patches are detected (Fig. A.16, black circles in the bottom left panel). The most distant is at rmax ∼ 90 kpc from the QSO2 nucleus. They have either none or very faint continuum counterparts. They have LHα ∼ (1−3) × 1039 erg s−1. Towards the SW of the QSO2, an elongated, very low surface-brightness of ∼30 kpc long feature (‘filament’ in the figure) is hinted at.
In addition to AGN related processes, additional ionisation mechanism(s) must be at work, since line emission is detected all over the place, up to 10s of kpc from the QSO2. There is gas all around the AGN and thus, a large fraction is outside the QSO2 ionisation cones.
A.2. Spatially extended small radio sources (∼few kpc from the AGN).
– J0948+25 (z = 0.179)
Only the SDSS images are available for this RQ QSO2 (Fig. 1). Two long tidal tails are clearly identified (Fig. A.17, top). The longest extends towards the SW for ∼29″ or 87 kpc.
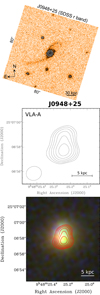 |
Fig. A.17. J0948+25 (z = 0.179). Top: SDSS r band image. Contour levels start at 3σ and increase with factor ×2. Middle: A-configuration map. Contour levels start at 150 μJy beam−1 and increase with factor |

The radio source is resolved only in the A-configuration VLA map, which shows a small ∼1.0–1.5″ extension towards the north from the core (Fig. A.17). L60 μm and q are not available (Sect. 2) so we cannot discern whether the radio emission has an AGN contribution (e.g., a potential small jet) or is instead dominated by star formation. The central region of the QSO2 host appears to show a similar elongation (Fig. A.17, bottom).
An ionised outflow is identified in the SDSS QSO2 spectrum. It has FWHM = 1133 ± 57 km s−1 and is blueshifted by −77 ± 16 km s−1 relative to the narrow line core (Fig. A.18). It contributes 32% of the total [OIII] flux.
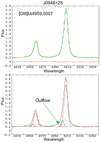 |
Fig. A.18. [OIII] doublet SDSS spectrum of J0948+25. Panels and line colour code as in Fig. A.5. The broadest of the three kinematic components isolated in the fit traces an ionised outflow (blue, bottom panel). Wavelength in Å. Fluxes in units of 10−15 erg s−1 cm−2 Å−1. |
– J1108+06 (z = 0.182)
This RQ QSO2 (Fig. 1) is a merging system which likely hosts two AGN separated by 0.7″ (Liu et al. 2010). Bondi et al. (2016) studied the radio and optical morphologies in detail based on VLA A-Array L (1.4 GHz), C (5.0 GHz), and X (8.5 GHz) bands and with the European VLBI Network (EVN) at 5 GHz. The radio source consists of multiple components located within ∼3″ (9 kpc). One of them is probably an AGN radio core. The extended radio emission is co-spatial with the U-band UV continuum emission seen in the HST image. They propose that intense star formation is the origin of both the radio and UV continua. The large q = 1.97 ± 0.07 is consistent with SF (Table 1).
We observed this source both with the A (28 min) and B (42 min) VLA configurations, for somewhat longer times than Bondi et al. (2016) (18, 27, and 21 min in A-configuration for bands L, C and X respectively). While the source appears unresolved in the B-array map, the A-configuration image shows a ∼2″ extension towards the north, already discussed by those authors. No additional radio emission is detected (Fig. A.19). No GTC images are available for this object and a radio or optical overlay is not shown.
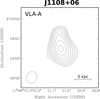 |
Fig. A.19. A-configuration map of J1108+06. Contour levels start at 300 μJy beam−1 and increase with factor |

We show in Fig. A.20 the SDSS spectrum of J1108+06 in the [OIII]λλ4949,5007 region and the best fit of the spectral profiles. The lines consist of two Gaussian narrow components (FWHM = 190 ± 13 and 242 ± 21 km s−1 shifted by 356 ± 8 km s−1). They are likely emitted by the two AGN, since the spatial separation ∼0.7″ is significantly smaller than the SDSS 3″ fibre. In addition, a prominent outflow (49% of the line flux) is detected (FWHM = 813 ± 25 km s−1 and blueshifted by Vs = −200 ± 8 km s−1 relative to the dominant narrow component).
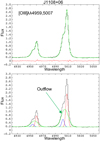 |
Fig. A.20. [OIII] doublet SDSS spectrum of J1108+06. The data (black), best fit (green), and residuals (red) are shown in the top panel. The three kinematic components isolated in the fit are shown in the bottom panel with different colours. The broadest component traces a prominent ionised outflow. Wavelength in Å. Fluxes in units of 10−15 erg s−1 cm−2 Å−1. |
– J1437+30 (B2 1435+30, z = 0.092)
This RQ/RI QSO2 (Fig. 1), shows a clear excess or radio emission (q = 0.43 ± 0.02, Table 2) and thus has a strong AGN contribution. It is is marginally resolved in the EW direction at the 1.3″ resolution of our super-uniformly weighted A-configuration data (Fig. A.21)
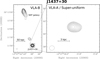 |
Fig. A.21. VLA radio maps of J1437+30. Same as Fig. A.1. Contour levels start at 350 μJy beam−1 (B-configuration) and 2 mJy beam−1 (A-configuration) and increase with factor |

The continuum and Hα GTC images are shown in Fig. A.22. The optical morphology is strongly distorted due to galactic merger or interaction processes. The QSO2 is associated with a large (30″ or ∼51 kpc) and amorphous continuum halo, a tidal tail that stretches for more than 60 kpc towards the S and other irregular features.
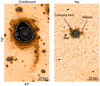 |
Fig. A.22. J1437+30. GTC continuum and Hα images. Contour levels in each image start at 3σ and increase with factor ×3 and 2 For the Hα and continuum images respectively. σ = 3.0 × 10⁻¹⁹ erg s−1 cm−2 pixel−1 for the Hα image. |
At the HST/ACS spatial resolution (HST program 13728; PI: S.B. Kraemer), the NLR consists of three spatial components located roughly along the EW direction (Fig. 8; HST program Fischer et al. 2018). Using the same terminology as the authors, these are a compact, bright unresolved core, a cone to the west of ∼2.5 kpc height and a compact arc at ∼2.0 kpc to the east. The overlay with our VLA map is shown in Fig. 8. The radio core is located at the base of the cone. It coincides with the continuum centroid (Fischer et al. 2018) and lies at the expected location of the AGN. The marginal extension of the radio source overlaps with the [OIII] cone, which is the highest SB emission line structure. The authors measured disturbed kinematics in the cone. All this suggests that the radio source is interacting with this gas. A higher resolution radio map would be necessary to investigate this, by characterising the radio morphology more accurately.
At the resolution of our GTC image (1.00 ± 0.05″, Table 3) and with the overwhelming glare of the compact [OIII] central source, the above NLR features are not resolved. The Hα emission is dominated by a compact, barely resolved source with FWHM = 1.38 ± 0.02″ (PA 169°) and 1.02 ± 0.01 along the major and minor axis respectively. On the other hand, lower SB line emission is detected on a significantly larger area than in the HST image.
A Hα knot is detected at ∼11 kpc NE of the QSO2 (Fig. A.22, right panel). The morphology suggests that it is a star-forming object. Assuming that the [NII] contamination is negligible and ignoring reddening, the implied Hα luminosity LHα = 1.7 × 1039 erg s−1 would imply SFR = 0.014 M⊙ yr−1. Low SB line emission is also detected up to ∼12 kpc to the W of the AGN. It is rather asymmetric, well in excess above the wings of the central, bright Hα source (thus, seeing smearing is not responsible). The QSO2 nucleus is saturated in the long exposures TF and continuum images. To check whether the extended nebula could, instead, be due to asymmetric saturation spikes, we carried out several tests using the continuum and TF images obtained with short exposures (90 instead of 900 s; see Sect. 3.1). The Hα low SB emission was securely or tentatively detected in all tests. The ∼12 kpc nebula is, thus, real. It is aligned with the NLR seen in the HST image and with the radio source. Thus, it is probably ionised by the QSO2 continuum.
J1437+30 hosts a nuclear ionised outflow (FWHM = 1254 ± 37 and Vs = +107 ± 16 km s−1) of radial size ∼170 pc (Villar-Martín et al. 2014; Fischer et al. 2018). It contributes ∼17% of the [OIII] nuclear flux.
– J1517+33 (z = 0.135)
This RI QSO2 is associated with the most powerful radio source of our sample and shows the highest radio excess (log(P1.4 GHz)) = 31.8, q = 0.36 ± 0.18, Table 2 and Fig. 1). It has been classified as a radio galaxy in some works (e.g., Rosario et al. 2010).
These authors obtained VLA A-configuration data in four bands: 1.4, 5, 8, and 22 GHz with exposure times at each frequency between five and ten minutes. The radio source consists of an unresolved flat-spectrum core and a steep spectrum bipolar jet extending ∼2″ (4.7 kpc) at both sides of the core (see also Tingay & Wayth 2011). The western jet shows a strong bend of about 75° at ∼1″ from the core, which is traced by the emission-line gas. They found a clear similarity in structure between the radio jet and the ionised gas, which moreover shows highly disturbed kinematics. They propose that the jet is responsible for triggering an outflow that is interacting with the galaxy ISM.
We observed this source with the A and B VLA configurations for 30 and 60 minutes on source respectively. The source is unresolved in the B configuration map (Fig. A.23). The two unresolved knots 0.8′ and 1.4′ to the east are unrelated (Tingay & Wayth 2011). The A configuration map shows an elongated bright source associated with the QSO2 which extends at both sides of the central radio core for ∼9 kpc in total. The bent morphology at ∼1″ from the core identified at 5 GHz by Rosario et al. (2010) is also appreciated. We do not detect additional radio emission. Since no new information is obtained and no GTC images are available, we do not explore further.
 |
Fig. A.23. VLA radio maps of J1517+33. Same as Fig. A.1. Contour levels start at 800 μJy beam−1 and increase with factor |

A.3. Marginally resolved and unresolved radio sources
– J0802+25 (z = 0.080)
This RQ QSO2 (Fig. 1) has a significant AGN contribution to the radio emission (q = 1.39 ± 0.06, Table 2). Our VLA maps show that the source is unresolved in both the A and B configuration maps. We do not show them for simplicity.
J0802+25 is a member of an interacting system with a complex optical morphology (Fig. A.24, see also Fischer et al. 2018). A tidal tail and a huge halo are identified in the GTC continuum image extending for ∼55″ or ∼82 kpc. The major axis of this halo runs in the E-W direction.
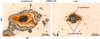 |
Fig. A.24. J0802+25. GTC continuum and Hα images. Contour levels in each image start at 3σ and increase with factor ×2. For the Hα image, σ = 2.7 × 10⁻¹⁹ erg s−1 cm−2 pixel−1. |
Fischer et al. (2018) studied the [OIII] morphology and kinematics based on HST/ACS images. [OIII] extends up to Rmax ∼ 2.8 kpc from the AGN towards the north and up to ∼1.5 kpc towards the south. They identified an ionised outflow with radial projected size Rout ∼ 0.44 kpc, overlapping with the [OIII] extended emission. Based on its extreme kinematic properties, Villar-Martín et al. (2014) proposed that this outflow has been triggered by a so far undetected small-scale radio jet (Mullaney et al. 2013; Molyneux et al. 2019).
Our Hα image (Fig. A.24, right panel) shows more extended line emission than the [OIII] HST image. Hα is detected up to ∼6 kpc from the QSO2 nucleus to the north. In addition, low SB ionised gas is detected roughly in the E-W direction. It has dmax ∼ 38 kpc and rmax ∼ 21 kpc (Fig. A.24, right panel). Multiple tests were done to investigate potential artefacts due to saturation spikes using also the short exposure images (Sect. 3) or inaccurate continuum subtraction as well as the potential impact of seeing smearing of the bright central source. We confirm the detection of the large nebula. The northern Hα extension (also identified by Fischer et al. 2018) is likely to be inside the AGN ionisation cone and roughly aligned with it. This is suggested by the higher SB of this gas and the fact that the nuclear ionised outflow is extended in this direction. If such scenario is correct, the large SB nebula lies at least partially outside the reach of the AGN ionising continuum. Excitation mechanisms unrelated to the nuclear activity (stellar photoionisation or other) must be at work.
– J1316+44 (z = 0.091)
The radio emission of this RQ QSO2 (Fig. 1) is consistent with being dominated by star formation (q = 2.35 ± 0.04). It is unresolved in the B configuration VLA image and appears marginally resolved in the A configuration map along PA ∼70°. The radio maps are not shown for simplicity.
Based on its high infrared luminosity, log(LIR/L⊙) = 11.9, J1316+44 is close to the ULIRG regime (Ultraluminous Infrared Galaxy, log(LIR/L⊙)> 12.0). This object has been classified as a type 1.9 AGN, rather than type 2 (e.g., Keel et al. 2012). Permitted lines such as Hβ and Hα show faint very broad wings in the SDSS spectrum originated in the broad line region (BLR). An ionised outflow is identified in the SDSS [OIII] doublet with FWHM 961 ± 27 km s−1 and blueshifted by −276 ± 17 km s−1 relative to the narrow line core (Fig. A.26). It contributes ∼40% of the total line flux.
J1316+44 is a member of a galaxy group at z ∼ 0.09. The GTC continuum image (Fig. A.25, left panel) shows tidal debris spread over a very large area, which extends up to ∼57 kpc to the N of the QSO2 nucleus. The host is interacting with G1 (z = 0.091, SDSS database). The nucleus of this galaxy is not detected in the Hα image, which is not surprising since the SDSS spectrum shows no emission lines. It is connected to the QSO2 host by a tidal bridge more clearly seen in the Hα image. The large G4 galaxy to the south is at significantly lower z = 0.060 (SDSS spectroscopic z).
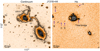 |
Fig. A.25. J1316+44. GTC continuum and Hα images. G1, G2 and G3 belong to the same group. G4 is at z = 0.060 and is unrelated. A to E in the middle panel highlight Hα features (see text). Contour levels in each image start at 3σ and increase with factor ×3. For the Hα image, σ = 2.6 × 10⁻¹⁹ erg s−1 cm−2 pixel−1. |
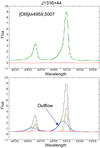 |
Fig. A.26. [OIII] doublet SDSS spectrum of J1316+44. Panels and line colour code as in Fig. A.5. The broadest of the three kinematic components isolated in the fit traces an ionised outflow (green, bottom panel). Wavelength in Å. Fluxes in units of 10−15 erg s−1 cm−2 Å−1. |
G2 and G3 at ∼90 kpc to the E (right on the edge of the CCD), are an interacting pair at the same z as the QSO2. The Hα image shows prominent emission from G2 and tidal features that point towards the QSO2 (see the tidal tail indicated with an E″ in Fig. A.25, right). The pair seems to be interacting also with the QSO2 host.
Multiple regions of star formation in the disk of the QSO2 host are seen in the Hα image. Emission line patches are also detected at different locations far from any galaxy (purple arrows in Fig. A.25, right). As an example, feature A is at ∼53 kpc N of the QSO2 nucleus. Features B, C and D may be part of a continuous gaseous ∼80 kpc tidal bridge that connects the QSO2 with the G2–G3 pair. The ionisation of these features could be due to local star formation induced by the galactic interaction across tens of kpc (Weilbacher et al. 2003). In this scenario, their low line luminosities LHα ∼ several × 1038 erg s−1 would imply SFR ∼ several × 10−3, consistent with SFR in tidal features of interacting galaxies (e.g., Duc & Renaud 2013).
Appendix B: Serendipitous discovery of two tailed radio galaxies at z = 0.33
There are two extended radio sources at ∼30″ and 2′ towards the NE of J1437+30 (Fig. A.21). Their location in the SDSS colour map is shown in Fig. B.1.
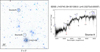 |
Fig. B.1. Location of the tailed radio sources A and B in the field of J1437+40 are indicated in the SDSS colour image. The SDSS spectrum of Source A is also shown. |
Source A, which is associated with SDSS J143740.38+301308.8 at z = 0.333 (Fig. B.1, right), is a tailed FRI radio galaxy (Fig. B.2, top). The radio emission in this type of sources consists in general of a head coincident with the optical galaxy and extensions in one direction in the form of trails or tails that form an angle with the galaxy apex (Ryle & Windram 1968). Depending on the angle, they are classified as wide (WAT) or narrow angle tailed (NAT) radio galaxies. Source A belongs to the second group. The SDSS optical spectrum (Fig. B.1, right) shows no emission lines. This is not surprising since Fanaroff–Riley type I (FRI, Fanaroff & Riley 1974) radio sources often show very weak emission lines (e.g., Baum et al. 1995; Wills et al. 2004) and the large size of the SDSS fibre (3″) can contribute to the dilution of any faint nuclear emission features.
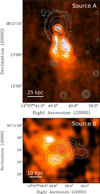 |
Fig. B.2. Tailed radio galaxies at z ∼ 0.33 in the field of J1437+30. Overlay between the VLA radio maps (coloured image and red contours) and the optical (grey) contours of the SDSS images. |
The radio source B is also extended Fig. (B.2, bottom) and overlaps with the galaxy SDSS J143738.41+301124.2. The SDSS photometric zph = 0.366 ± 0.030 suggests that it belongs to the same system as source A. One possible scenario is that B is a radio lobe associated with J1437+30. However, based on the multi-component morphology and the proximity of SDSS J143738.41+301124.2, we consider more likely that it not related to the QSO2. The radio morphology is reminiscent of a WAT radio galaxy. The two ‘trail’ components are significantly brighter than the poorly defined ‘head’. This overlaps precisely with the optical galaxy. Such morphology is somewhat peculiar (e.g., Mao et al. 2010), but it is not without precedents (O’Brien et al. 2018).
It has been suggested that tailed radio galaxies are members of clusters of galaxies and, as such, they have been proposed to be signposts of clusters at different z (e.g., Miley et al. 1972; Giacintucci & Venturi 2009; Mao et al. 2010; but see also O’Brien et al. 2018). Their peculiar morphologies are thought to be a consequence of the deceleration of the diffuse radio-emitting plasma by the intracluster medium as the radio source moves through the gas in the cluster. Sources A and B in the field of J1437+30 are separated by ∼510 kpc in projection. Examples of two tailed radio galaxies in the same cluster have been reported in the literature (e.g., Giacintucci & Venturi 2009).
Whether sources A and B belong to a galaxy cluster is beyond the scope of this study, but an overdensity of objects at this z is suggested by the fact that at least three more galaxies in the field (C, D and E; Fig. B.2) have similar z ∼ 0.33.
All Tables
Classification of the QSO2 VLA sample according to the possible existence of extended (5″) radio emission based on Kimball & Ivezić (2008).
All Figures
|
Fig. 1. Location of the object sample (large symbols) in the [OIII]λ5007 vs. monochromatic 5.0 GHz luminosity plane (Xu et al. 1999). Triangles are used for radio sources with total sizes |
| In the text | |
|
Fig. 2. GTC Hα image of J0841+01 on a log scale, with overlaid contours of the VLA A-configuration (red) and B-configuration (grey) data. Contour levels are the same as in Fig. A.1. The inset shows the contours of the VLA A-configuration data overlaid onto the smoothed HST [OIII]λ5007 continuum subtracted image from Storchi-Bergmann et al. (2018). In these and other radio-Hα overlays, the directions of the axes used to measure the degree of alignment between the radio (solid lines) and the ionised gas (dashed lines) structures are indicated. The same colour is used for axes on the same side of the AGN (see Sect. 4.3). |
| In the text | |
|
Fig. 3. GTC Hα image of J0853+38, with overlaid contours of the VLA A-configuration (red) and B-configuration (grey) data. Contour levels are the same as in Fig. A.3, and features indicated as image artefacts in the B-configuration data of Fig. A.3 have been omitted. |
| In the text | |
|
Fig. 4. GTC Hα image of J0907+46, with overlaid contours of the VLA A-configuration (red) and B-configuration (grey) data. Contour levels start at 0.08 (0.2) mJy bm−1 for the A (B) configuration data, and increase by factor 2. Radio and Hα axes as in Fig. 2. |
| In the text | |
|
Fig. 5. HST/WFC FR551N (containing [OIII]) image of J0945+17, with overlaid contours of the VLA A (red) and B-configuration (grey) data. Contour levels start at 0.45 (0.5) mJy bm−1 for the A (B) configuration data, and increase by factor 2. LR:A and LR:B are the radio components identified by Jarvis et al. (2019). Radio and Hα axes as in Fig. 2. |
| In the text | |
|
Fig. 6. GTC Hα image of J1000+12, with overlaid contours of the VLA A (red) and B-configuration (grey) data. Contour levels are the same as in Fig. A.12. The inset shows the contours of the VLA A-configuration data overlaid onto the HST WFC3/FQ508N narrow-band filter that contains [OIII] emission. The dashed black rectangle marks the approximate location of the giant [OIII] bubble proposed by Jarvis et al. (2019). The narrow extension of radio emission at this location, which we coloured light-red in the small panel, is most likely dominated by artefacts of the snap-shot imaging. LR:A to LR:D indicate the main radio components with the same nomenclature as in Jarvis et al. (2019). Radio and Hα axes as in Fig. 2. |
| In the text | |
|
Fig. 7. J1356+10. GTC Hα image of J1356+10, with overlaid contours of the VLA A-configuration in red, and the extended emission from the B-configuration data in grey (see Fig. A.14 for details). The inset highlights the central region of the galaxy, with the GTC image shown at a higher contrast. Radio and Hα axes as in Fig. 2. |
| In the text | |
|
Fig. 8. J1437+30. HST/ACS image taken with the FR551N filter (covering [OIII]λ5007) with overlaid contours of the VLA A-configuration data with super-uniform weighting from Fig. A.21. The HST image is contaminated by continuum, but the high SB features trace the ionised gas morphology accurately (Fischer et al. 2018). Radio and Hα axes as in Fig. 2. |
| In the text | |
|
Fig. 9. Classification of the 11 QSO2 in our 13 QSO2 sample with confirmed AGN related radio emission according to the maximum size of the AGN component (in brackets). This coincides with |
| In the text | |
|
Fig. 10. Classification of the most interesting extended ionised features identified in the 13 QSO2 of our sample. The ‘giant nebulae’ describe large continuous reservoirs of gas with sizes > 35 kpc that are not identified with bubbles, tidal features (bridges or tails), with star formation (e.g., spiral arms) or with detached features (e.g., distant patches). ‘Jet-gas interactions’ refer to emission line features that are closely correlated with the radio morphology. This correlation indicates an interaction between the gas and the radio source. ‘Star formation’ encompasses detached compact knots and SF in spiral arms. ‘Distant patches’ refer to detached patches of ionised gas located at large distances from the AGN (tens of kpc). |
| In the text | |
|
Fig. 11. Relative angles ΔPA = |PArad − PAopt| between the radio and ionised gas axes measured in the eight QSO2 indicated in this plot (see text). They have been grouped in three bins according to ΔPA < 10°, 10° ≤ΔPA < 20° and 20 ≤ ΔPA < 30°. For each object, the number of radio-Hα angles in that specific bin is shown in brackets. The radio and gas axes are in general very closely aligned. For seven objects (first bin), the axes are identical or almost identical (ΔPA < 10°) at least on one side of the AGN. |
| In the text | |
|
Fig. A.1. VLA radio maps of J0841+01. Left: B-configuration map. Contour levels start at 100 μJy beam−1 and increase by factor |
| In the text | |
|
Fig. A.2. J0841+01. GTC continuum (left) and Hα images (middle). Contour values start at 3σ and increase with factor ×2. For the Hα image, σ = 4.1 × 10⁻¹⁹ erg−1 cm−2 pixel−1. QSO2 and C indicate the QSO2 and the companion galaxy. TDG is a tidal dwarf galaxy candidate (see text). The small right panel zooms in the central region of the HST WFC3/UVIS F438W image, which contains the [OII]λ3727 doublet. The intricate filamentary structures between the two galaxies are dominated by gas emission. They are reminiscent of a giant ionised bubble. In this and all figures the Hα images have been continuum subtracted. Also, N is always up and E is left. |
| In the text | |
|
Fig. A.3. VLA radio maps of J0853+38. Same as Fig. A.1. Contour levels start at 60 μJy beam−1 (B-configuration) and 100 μJy beam−1 (A-configuration) and increase with factor |
| In the text | |
|
Fig. A.4. J0853+38. GTC continuum and Hα images. Contour values start at 3σ and increase with factor ×2. For the Hα image, σ = 3.4 × 10⁻¹⁹ erg−1 cm−2 pixel−1. The purple arrows in the right panel mark distant patches of Hα emission. |
| In the text | |
|
Fig. A.5. [OIII] doublet SDSS spectrum of J0853+38. Wavelength in Å. A fit (green) and residuals (red) are shown in the top panel with the data (black). The three kinematic components isolated in the fit are shown in the bottom panel with different colours. The broadest component may trace an ionised outflow, but higher S/N data is needed to confirm this. Wavelength in Å. Fluxes in units of 10−15 erg s−1 cm−2 Å−1. |
| In the text | |
|
Fig. A.6. VLA radio maps of J0907+46. Same as Fig. A.1. Contour levels start at 200 μJy beam−1 (B-configuration) and 80 μJy beam−1 (A-configuration) and increase with factor of |
| In the text | |
|
Fig. A.7. J0907+46. GTC continuum and Hα images. GTC continuum and Hα images. Contour values start at 3σ and increase with factor ×2. For the Hα image, σ = 2.4 × 10⁻¹⁹ erg−1 cm−2 pixel−1. The purple arrows in the right panel mark distant patches of Hα emission. The contours highlight the different shape of the continuum and Hα isophotes. The small continuum source in the left panel is a tidal dwarf galaxy (TDG) candidate. Its location in the Hα image is shown with a small circle. |
| In the text | |
|
Fig. A.8. [OIII] doublet SDSS spectrum of J0907+46. Panels and line colour code as in Fig. A.5. The broadest of the two kinematic components isolated in the fit traces an ionised outflow (blue, bottom panel). Wavelength in Å. Fluxes in units of 10−15 erg s−1 cm−2 Å−1. |
| In the text | |
|
Fig. A.9. VLA radio maps of J0945+17. Same as Fig. A.1. Contour levels start at 500 μJy beam−1 and increase with factor |
| In the text | |
|
Fig. A.10. J0945+17. Left: HST WFPC F814W continuum image. This filter covers the spectral range of 7617–8921 Å (6752–7909 Å rest frame) and is thus dominated by continuum. Middle panel: HST ACS /WFC FR716N image containing Hα+[NII] (the images are not flux calibrated). It has been rotated to show N up and E left. The contours start at 3σ and increase with a factor ×2 (continuum image) and ×3 (narrow band image). The region of the cloud and the giant bubble candidate is zoomed in the right panel. The extended filamentary structures are dominated by line emission. The ‘cloud’ at ∼11 kpc to the west was identified by Storchi-Bergmann et al. (2018). It is part of a spectacular ensemble of ionised filaments whose morphology is reminiscent of a giant bubble. |
| In the text | |
|
Fig. A.11. [OIII] doublet SDSS spectrum of J0945+17. Panels and line colour code as in Fig. A.5. The broadest of the three kinematic components isolated in the fit traces a prominent ionised outflow (blue, bottom panel). Wavelength in Å. Fluxes in units of 10−14 erg s−1 cm−2 Å−1. |
| In the text | |
|
Fig. A.12. VLA radio maps of J1000+12. Same as Fig. A.1. Contour levels start at 150 μJy beam−1 (B-configuration) and 93 μJy beam−1 (A-configuration) and increase with factor |
| In the text | |
|
Fig. A.13. J1000+12. GTC continuum and Hα images. Contour values start at 3σ and increase with factor of two or three for the continuum and Hα images, respectively. For the Hα image, σ = 3.8 × 10⁻¹⁹ erg−1 cm−2 pixel−1. Right panel: Hα emission in a smaller region centred on the QSO2 with a different colour palette. The small green * symbol in the middle panel shows the expected location of the TDG candidate identified in the continuum image. Several additional features mentioned in the text are indicated with purple arrows. |
| In the text | |
|
Fig. A.14. VLA radio maps of J1356+10. Same as Fig. A.1. Contour levels for the B-configuration data start at 3.5, 4.5, 5.5σ and then increase in steps of |
| In the text | |
|
Fig. A.15. J1356+10. GTC continuum and Hα images. Contour levels in the continuum (first panel) and Hα images (second panel) start at 3σ and increase with factor ×2.5. For the Hα image, σ = 4.4 × 10⁻¹⁹ erg s−1 cm−2 pixel−1. Galaxies G1, G3, G4 and possibly G2, G5, and G6 are members of the same group as the QSO2 (see text). The rectangular areas in the second panel are zoomed in the 3th (top rectangle) and 4th (bottom rectangle) panels. The contours in these trace the morphology within the high SB regions. The purple arrows in the last panel show the location of the giant 12 kpc bubble, the clumps and wisps identified by Greene et al. (2012). Additional faint Hα features are also indicated. Ionised gas is detected up to ∼16 kpc to the east and west of the long tidal filament (third panel). |
| In the text | |
|
Fig. A.16. Teacup. Continuum (left) and Hα images with two different contrasts (middle and right panels) to highlight individual features and the giant low surface brightness halo (right). Contour values start at 3σ and increase with factor ×3 for the Hα image (σ = 3.2 × 10⁻¹⁹ erg−1 cm−2 pixel−1) and ×1.5 for the continuum image. The contours in the middle panel are shown to identify the well known ionised bubbles. The different features marked on the right panel are discussed in the text. The black circles enclose distant Hα patches. |
| In the text | |
|
Fig. A.17. J0948+25 (z = 0.179). Top: SDSS r band image. Contour levels start at 3σ and increase with factor ×2. Middle: A-configuration map. Contour levels start at 150 μJy beam−1 and increase with factor |
| In the text | |
|
Fig. A.18. [OIII] doublet SDSS spectrum of J0948+25. Panels and line colour code as in Fig. A.5. The broadest of the three kinematic components isolated in the fit traces an ionised outflow (blue, bottom panel). Wavelength in Å. Fluxes in units of 10−15 erg s−1 cm−2 Å−1. |
| In the text | |
|
Fig. A.19. A-configuration map of J1108+06. Contour levels start at 300 μJy beam−1 and increase with factor |
| In the text | |
|
Fig. A.20. [OIII] doublet SDSS spectrum of J1108+06. The data (black), best fit (green), and residuals (red) are shown in the top panel. The three kinematic components isolated in the fit are shown in the bottom panel with different colours. The broadest component traces a prominent ionised outflow. Wavelength in Å. Fluxes in units of 10−15 erg s−1 cm−2 Å−1. |
| In the text | |
|
Fig. A.21. VLA radio maps of J1437+30. Same as Fig. A.1. Contour levels start at 350 μJy beam−1 (B-configuration) and 2 mJy beam−1 (A-configuration) and increase with factor |
| In the text | |
|
Fig. A.22. J1437+30. GTC continuum and Hα images. Contour levels in each image start at 3σ and increase with factor ×3 and 2 For the Hα and continuum images respectively. σ = 3.0 × 10⁻¹⁹ erg s−1 cm−2 pixel−1 for the Hα image. |
| In the text | |
|
Fig. A.23. VLA radio maps of J1517+33. Same as Fig. A.1. Contour levels start at 800 μJy beam−1 and increase with factor |
| In the text | |
|
Fig. A.24. J0802+25. GTC continuum and Hα images. Contour levels in each image start at 3σ and increase with factor ×2. For the Hα image, σ = 2.7 × 10⁻¹⁹ erg s−1 cm−2 pixel−1. |
| In the text | |
|
Fig. A.25. J1316+44. GTC continuum and Hα images. G1, G2 and G3 belong to the same group. G4 is at z = 0.060 and is unrelated. A to E in the middle panel highlight Hα features (see text). Contour levels in each image start at 3σ and increase with factor ×3. For the Hα image, σ = 2.6 × 10⁻¹⁹ erg s−1 cm−2 pixel−1. |
| In the text | |
|
Fig. A.26. [OIII] doublet SDSS spectrum of J1316+44. Panels and line colour code as in Fig. A.5. The broadest of the three kinematic components isolated in the fit traces an ionised outflow (green, bottom panel). Wavelength in Å. Fluxes in units of 10−15 erg s−1 cm−2 Å−1. |
| In the text | |
|
Fig. B.1. Location of the tailed radio sources A and B in the field of J1437+40 are indicated in the SDSS colour image. The SDSS spectrum of Source A is also shown. |
| In the text | |
|
Fig. B.2. Tailed radio galaxies at z ∼ 0.33 in the field of J1437+30. Overlay between the VLA radio maps (coloured image and red contours) and the optical (grey) contours of the SDSS images. |
| In the text | |
Current usage metrics show cumulative count of Article Views (full-text article views including HTML views, PDF and ePub downloads, according to the available data) and Abstracts Views on Vision4Press platform.
Data correspond to usage on the plateform after 2015. The current usage metrics is available 48-96 hours after online publication and is updated daily on week days.
Initial download of the metrics may take a while.