Free Access
Fig. 7.
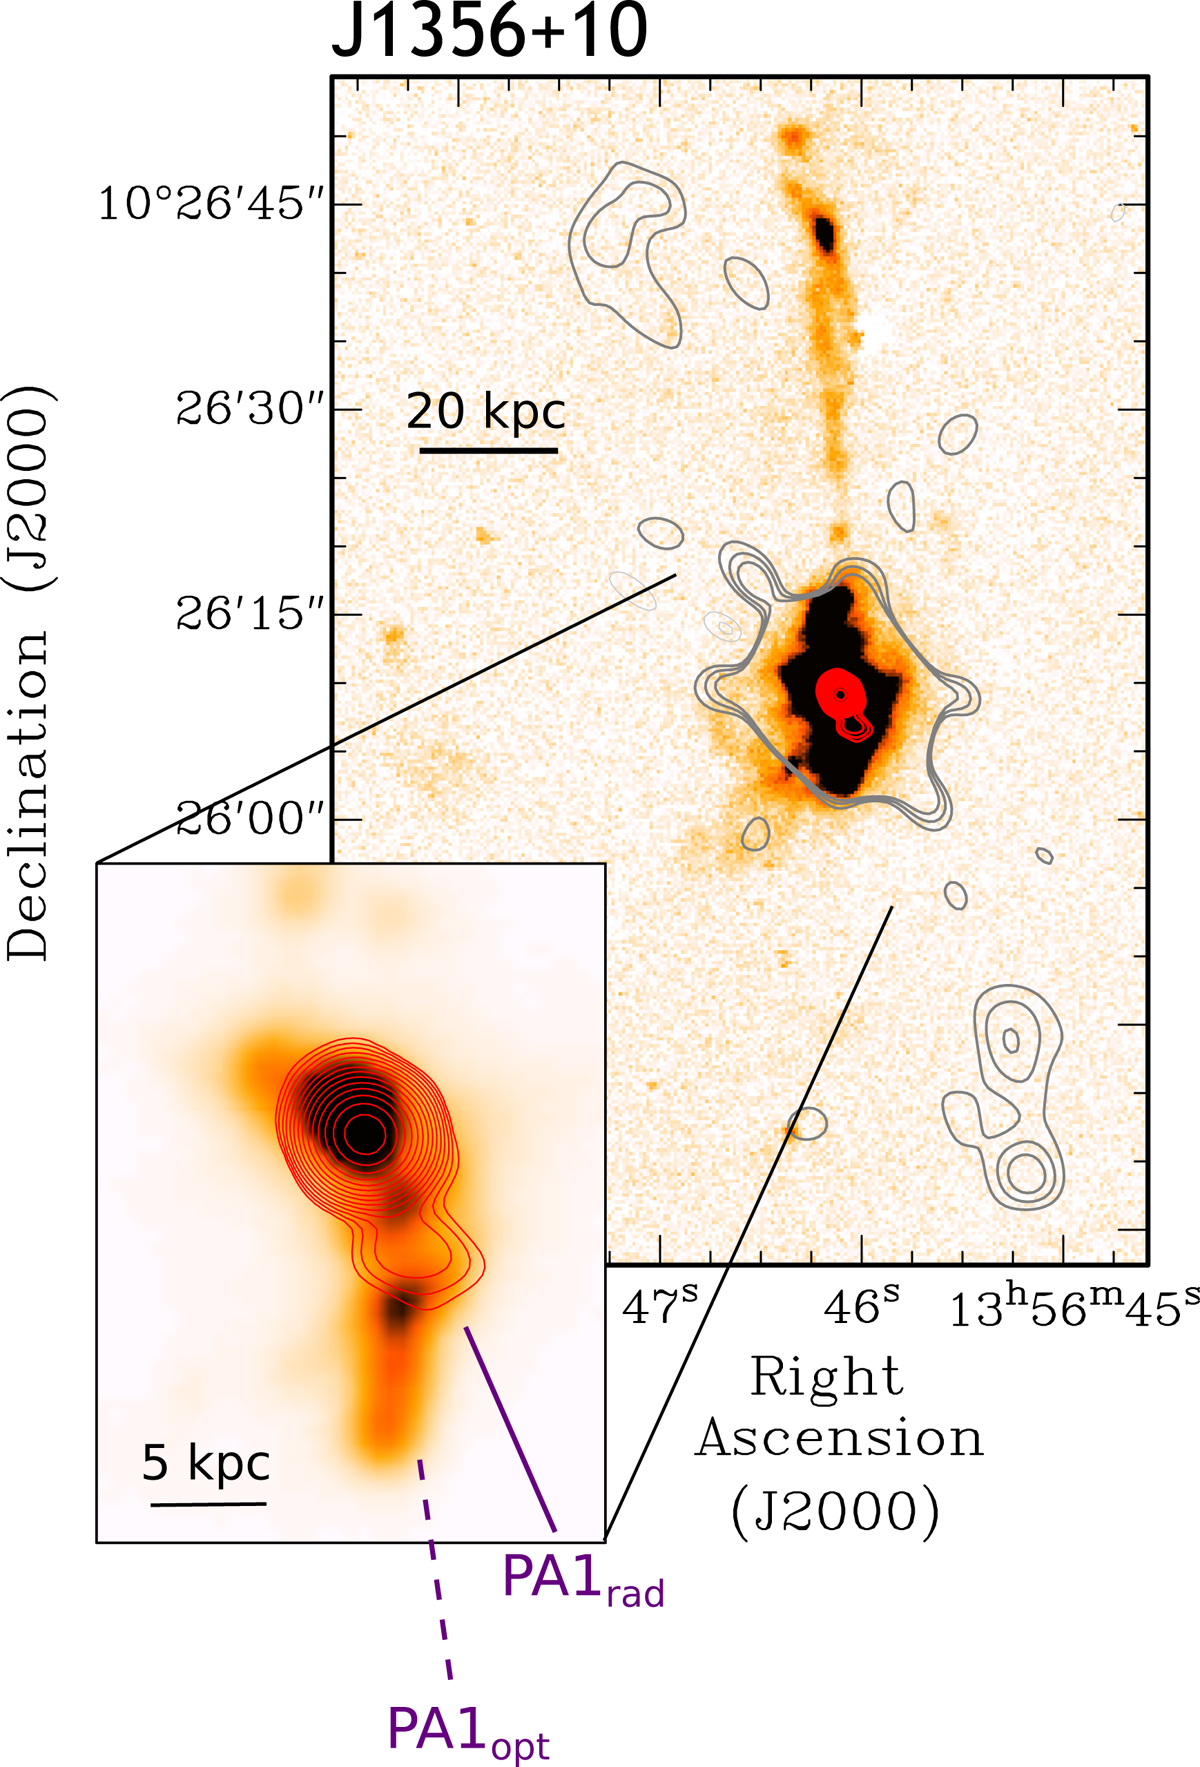
J1356+10. GTC Hα image of J1356+10, with overlaid contours of the VLA A-configuration in red, and the extended emission from the B-configuration data in grey (see Fig. A.14 for details). The inset highlights the central region of the galaxy, with the GTC image shown at a higher contrast. Radio and Hα axes as in Fig. 2.
Current usage metrics show cumulative count of Article Views (full-text article views including HTML views, PDF and ePub downloads, according to the available data) and Abstracts Views on Vision4Press platform.
Data correspond to usage on the plateform after 2015. The current usage metrics is available 48-96 hours after online publication and is updated daily on week days.
Initial download of the metrics may take a while.