Fig. A.7.
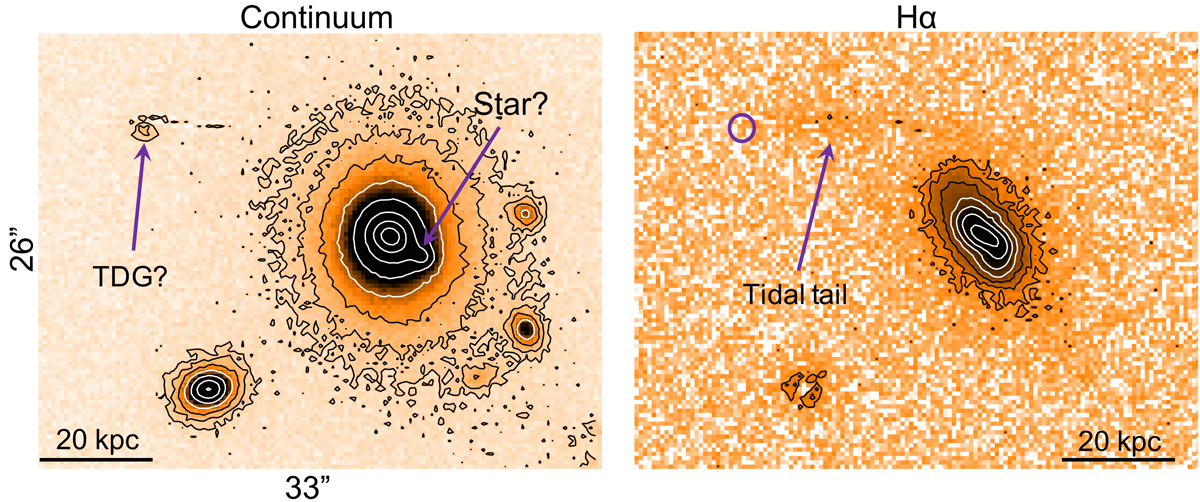
J0907+46. GTC continuum and Hα images. GTC continuum and Hα images. Contour values start at 3σ and increase with factor ×2. For the Hα image, σ = 2.4 × 10⁻¹⁹ erg−1 cm−2 pixel−1. The purple arrows in the right panel mark distant patches of Hα emission. The contours highlight the different shape of the continuum and Hα isophotes. The small continuum source in the left panel is a tidal dwarf galaxy (TDG) candidate. Its location in the Hα image is shown with a small circle.
Current usage metrics show cumulative count of Article Views (full-text article views including HTML views, PDF and ePub downloads, according to the available data) and Abstracts Views on Vision4Press platform.
Data correspond to usage on the plateform after 2015. The current usage metrics is available 48-96 hours after online publication and is updated daily on week days.
Initial download of the metrics may take a while.