Fig. 1.
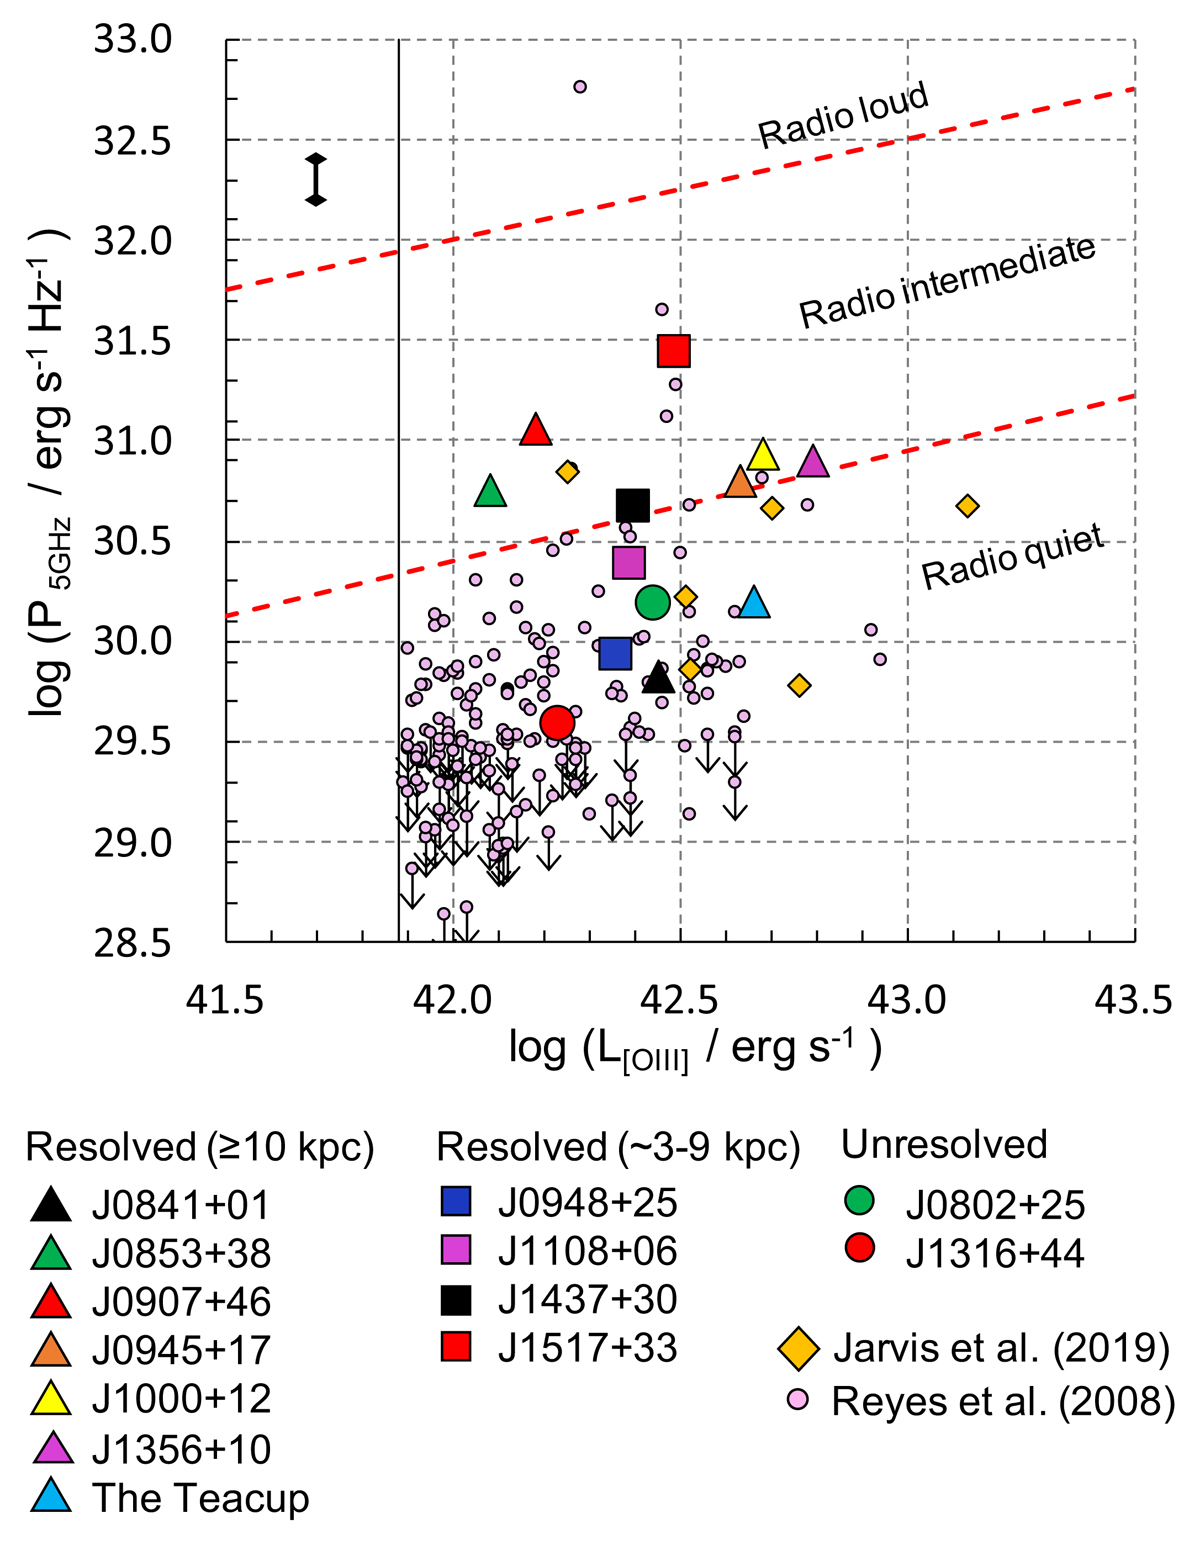
Location of the object sample (large symbols) in the [OIII]λ5007 vs. monochromatic 5.0 GHz luminosity plane (Xu et al. 1999). Triangles are used for radio sources with total sizes ![]() kpc (see Table 5), squares for
kpc (see Table 5), squares for ![]() kpc and circles for spatially unresolved or marginally resolved objects. The vertical small bar shows the expected uncertainty of the radio luminosities due to the unknown spectral index α. Jarvis et al. (2019) objects not included in our sample are also shown for comparison. The small pink circles are QSO2 at z < 0.2 in Reyes et al. (2008) catalogue. The vertical solid line marks the lower [OIII] luminosity these authors assumed to select QSO2. Arrows indicate upper limits for objects with no FIRST detections. The areas above and below the red dashed lines are filled with AGN classified as RL and RQ respectively (Xu et al. 1999). The gap is populated much more sparsely by radio intermediate (RI) AGN. Our sample includes several RI sources.
kpc and circles for spatially unresolved or marginally resolved objects. The vertical small bar shows the expected uncertainty of the radio luminosities due to the unknown spectral index α. Jarvis et al. (2019) objects not included in our sample are also shown for comparison. The small pink circles are QSO2 at z < 0.2 in Reyes et al. (2008) catalogue. The vertical solid line marks the lower [OIII] luminosity these authors assumed to select QSO2. Arrows indicate upper limits for objects with no FIRST detections. The areas above and below the red dashed lines are filled with AGN classified as RL and RQ respectively (Xu et al. 1999). The gap is populated much more sparsely by radio intermediate (RI) AGN. Our sample includes several RI sources.
Current usage metrics show cumulative count of Article Views (full-text article views including HTML views, PDF and ePub downloads, according to the available data) and Abstracts Views on Vision4Press platform.
Data correspond to usage on the plateform after 2015. The current usage metrics is available 48-96 hours after online publication and is updated daily on week days.
Initial download of the metrics may take a while.