Fig. 6.
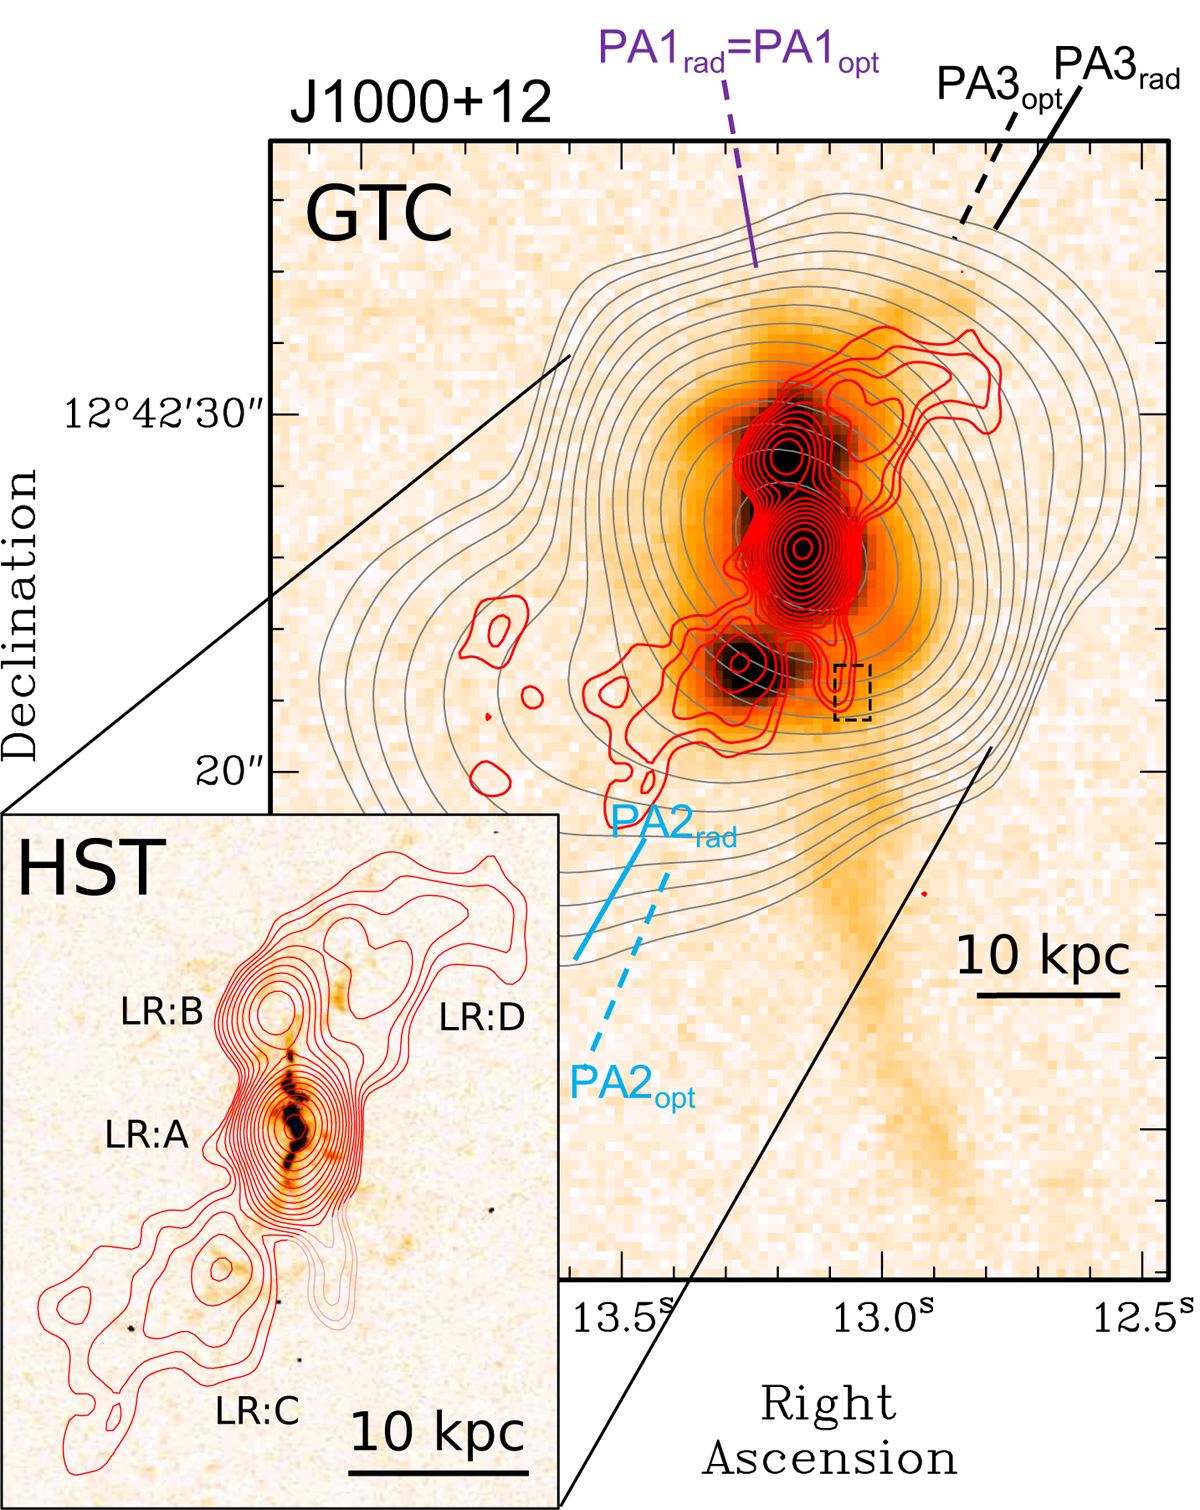
GTC Hα image of J1000+12, with overlaid contours of the VLA A (red) and B-configuration (grey) data. Contour levels are the same as in Fig. A.12. The inset shows the contours of the VLA A-configuration data overlaid onto the HST WFC3/FQ508N narrow-band filter that contains [OIII] emission. The dashed black rectangle marks the approximate location of the giant [OIII] bubble proposed by Jarvis et al. (2019). The narrow extension of radio emission at this location, which we coloured light-red in the small panel, is most likely dominated by artefacts of the snap-shot imaging. LR:A to LR:D indicate the main radio components with the same nomenclature as in Jarvis et al. (2019). Radio and Hα axes as in Fig. 2.
Current usage metrics show cumulative count of Article Views (full-text article views including HTML views, PDF and ePub downloads, according to the available data) and Abstracts Views on Vision4Press platform.
Data correspond to usage on the plateform after 2015. The current usage metrics is available 48-96 hours after online publication and is updated daily on week days.
Initial download of the metrics may take a while.