Fig. A.17.
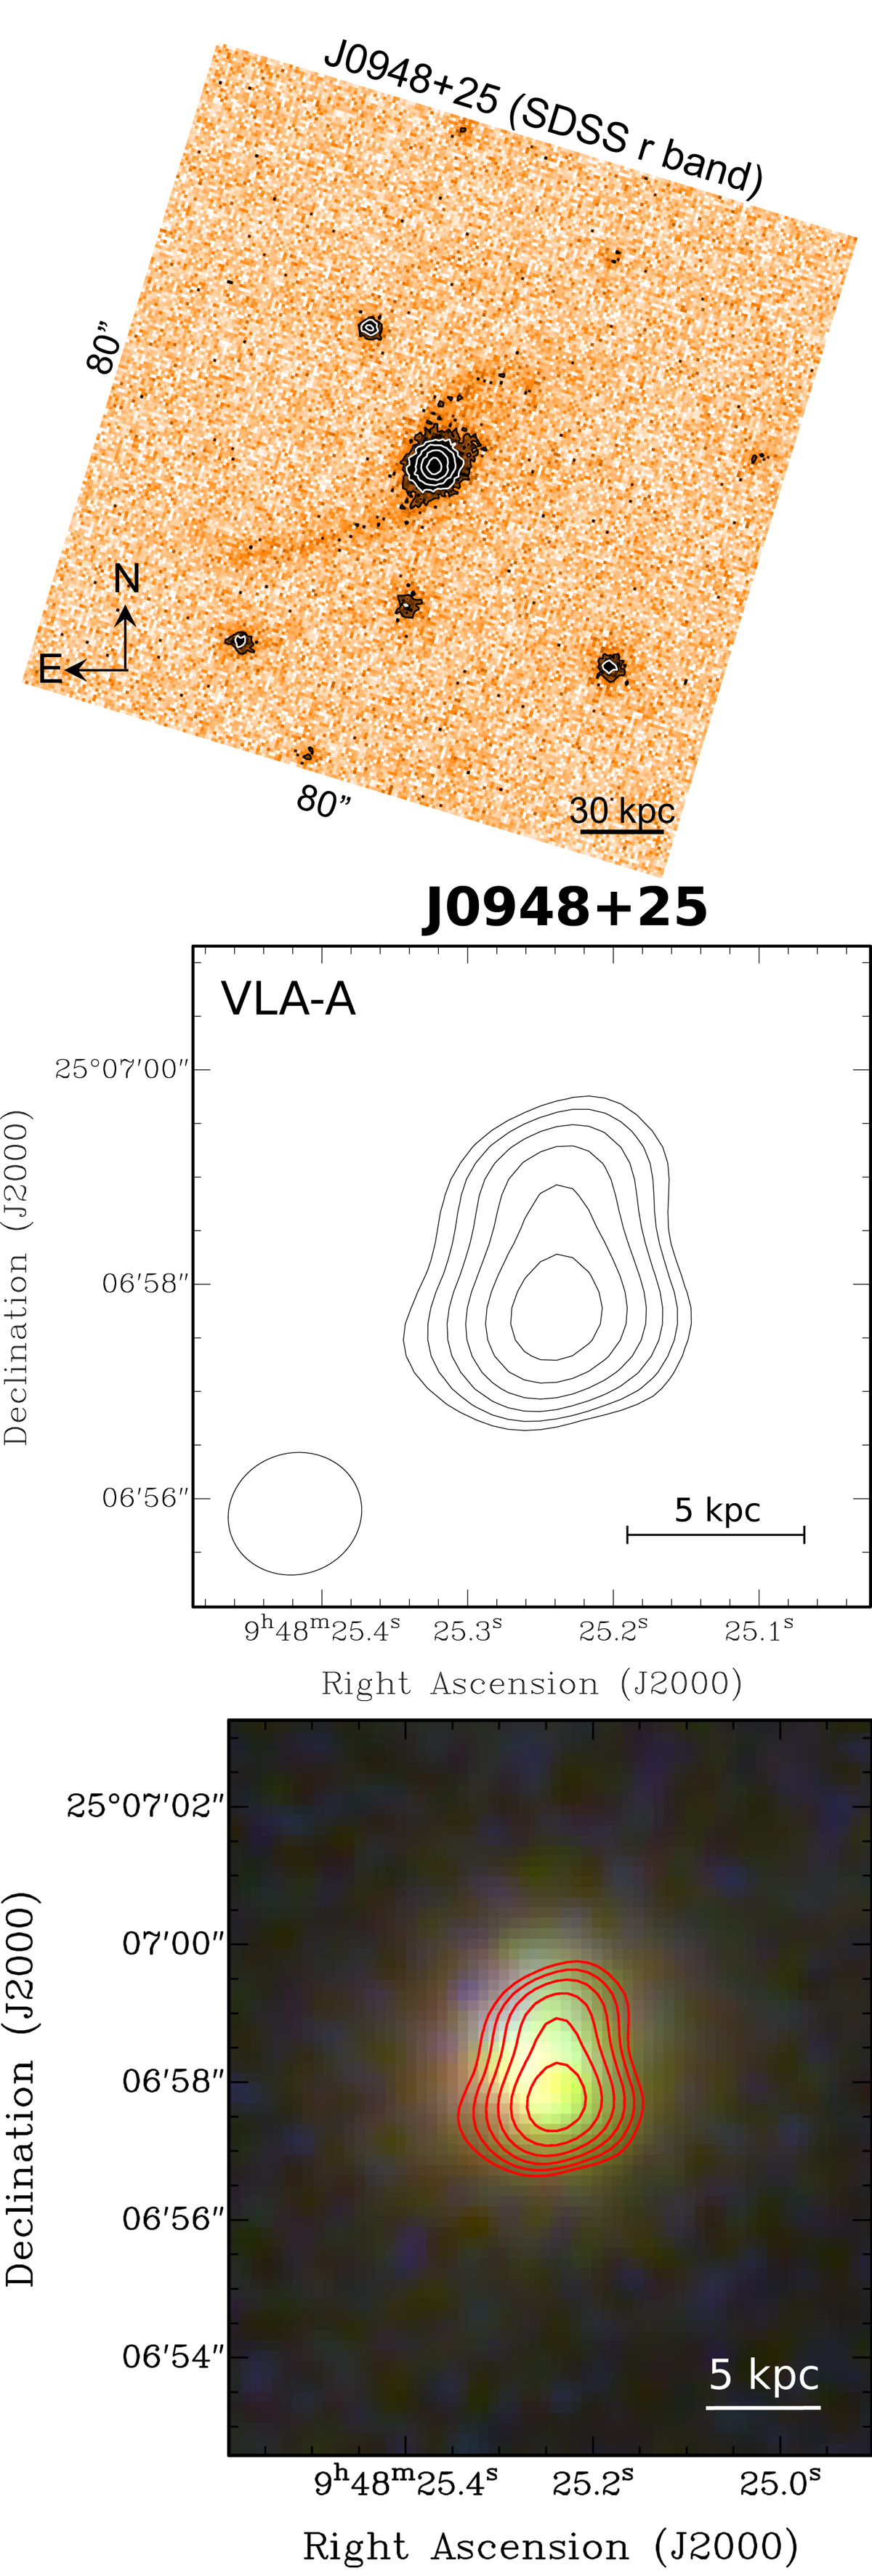
J0948+25 (z = 0.179). Top: SDSS r band image. Contour levels start at 3σ and increase with factor ×2. Middle: A-configuration map. Contour levels start at 150 μJy beam−1 and increase with factor ![]() . The radio source is confined within the galaxy size. This source is unresolved in B-configuration. Bottom: SDSS three-colour image (u, g, r) of the host galaxy is shown with overlaid contours of the VLA A-configuration data. This colour map shows more clearly the similar elongation angle and size of the host and the radio source.
. The radio source is confined within the galaxy size. This source is unresolved in B-configuration. Bottom: SDSS three-colour image (u, g, r) of the host galaxy is shown with overlaid contours of the VLA A-configuration data. This colour map shows more clearly the similar elongation angle and size of the host and the radio source.
Current usage metrics show cumulative count of Article Views (full-text article views including HTML views, PDF and ePub downloads, according to the available data) and Abstracts Views on Vision4Press platform.
Data correspond to usage on the plateform after 2015. The current usage metrics is available 48-96 hours after online publication and is updated daily on week days.
Initial download of the metrics may take a while.