Fig. A.14.
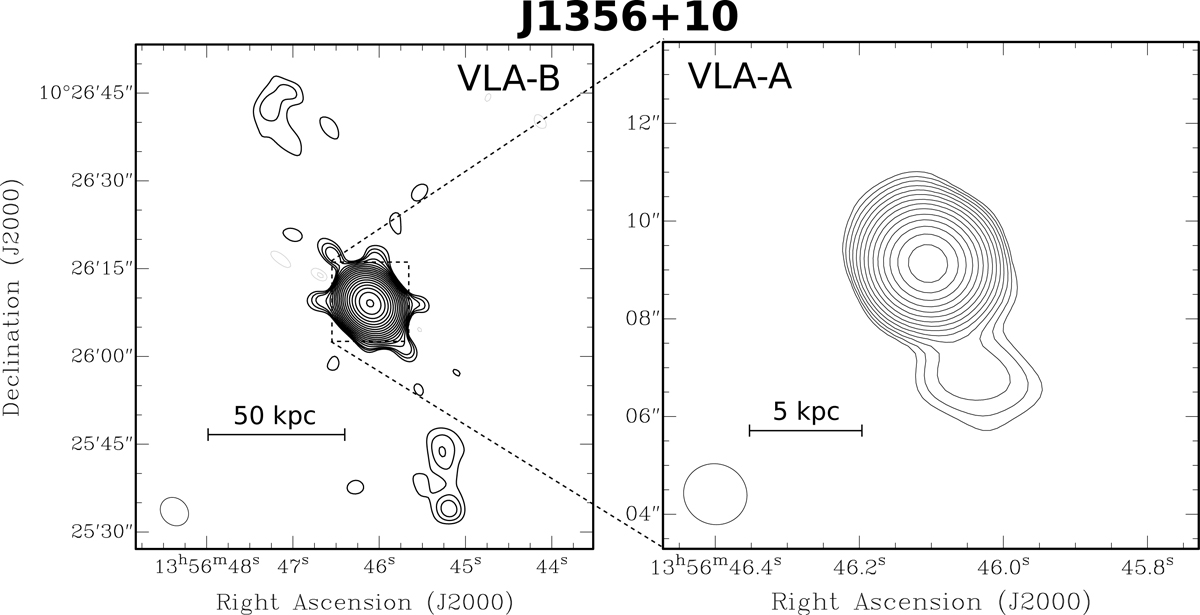
VLA radio maps of J1356+10. Same as Fig. A.1. Contour levels for the B-configuration data start at 3.5, 4.5, 5.5σ and then increase in steps of ![]() , with σ ∼ 37 μJy beam−1 the local rms noise. At these low levels, image artefacts are visible around the strong core. Negative contours are shown at the same level in grey. Contours of the A-configuration data start at 450 μJy beam−1 and increase with factor
, with σ ∼ 37 μJy beam−1 the local rms noise. At these low levels, image artefacts are visible around the strong core. Negative contours are shown at the same level in grey. Contours of the A-configuration data start at 450 μJy beam−1 and increase with factor ![]() .
.
Current usage metrics show cumulative count of Article Views (full-text article views including HTML views, PDF and ePub downloads, according to the available data) and Abstracts Views on Vision4Press platform.
Data correspond to usage on the plateform after 2015. The current usage metrics is available 48-96 hours after online publication and is updated daily on week days.
Initial download of the metrics may take a while.