Free Access
Fig. A.25.
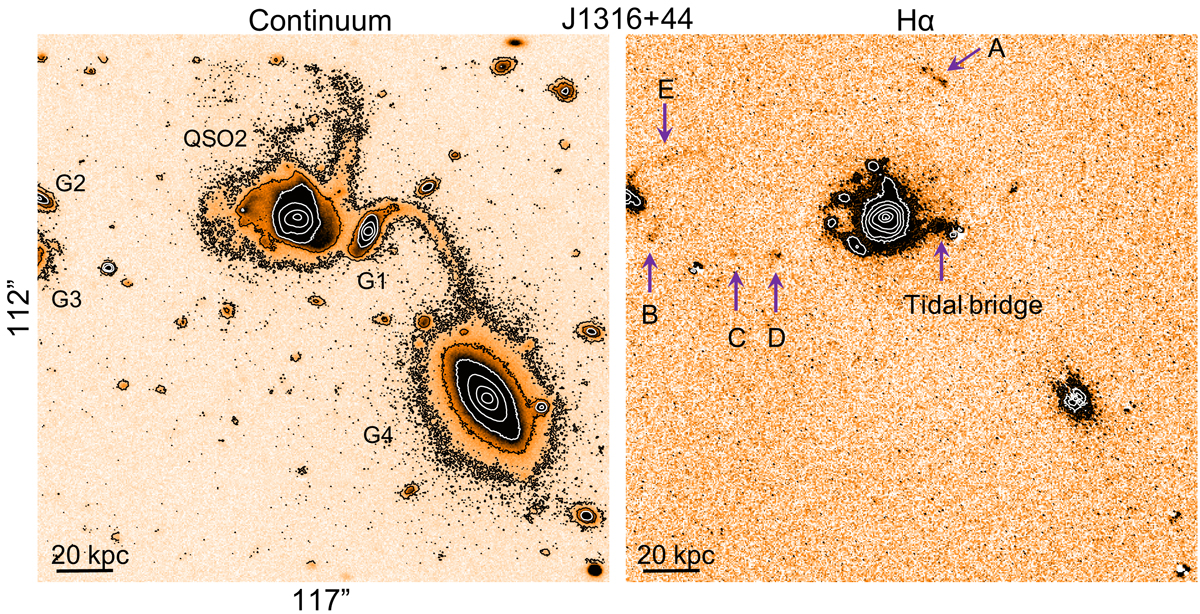
J1316+44. GTC continuum and Hα images. G1, G2 and G3 belong to the same group. G4 is at z = 0.060 and is unrelated. A to E in the middle panel highlight Hα features (see text). Contour levels in each image start at 3σ and increase with factor ×3. For the Hα image, σ = 2.6 × 10⁻¹⁹ erg s−1 cm−2 pixel−1.
Current usage metrics show cumulative count of Article Views (full-text article views including HTML views, PDF and ePub downloads, according to the available data) and Abstracts Views on Vision4Press platform.
Data correspond to usage on the plateform after 2015. The current usage metrics is available 48-96 hours after online publication and is updated daily on week days.
Initial download of the metrics may take a while.