Fig. A.3.
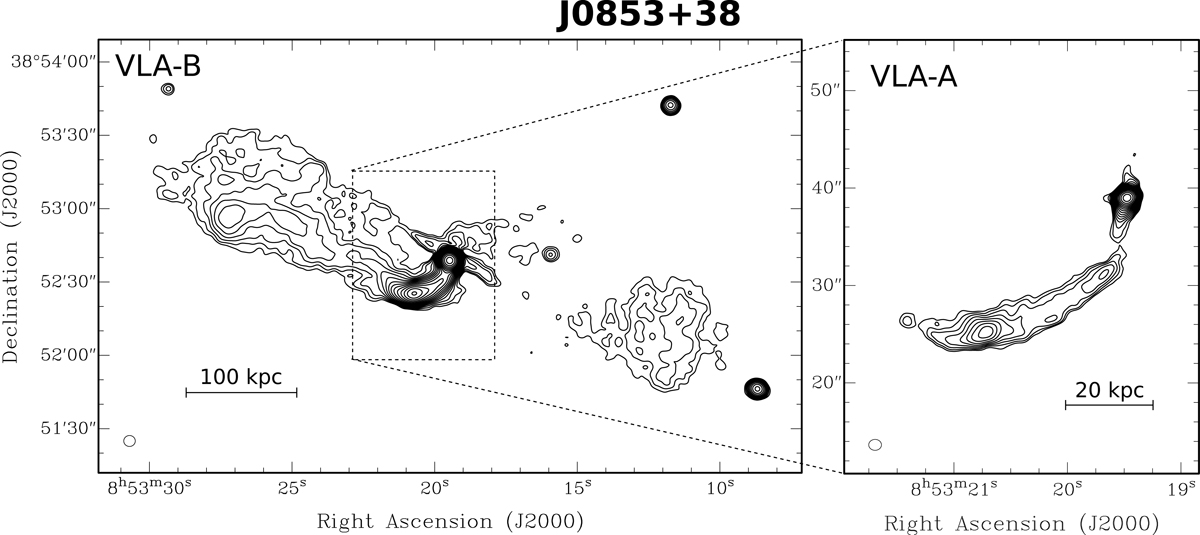
VLA radio maps of J0853+38. Same as Fig. A.1. Contour levels start at 60 μJy beam−1 (B-configuration) and 100 μJy beam−1 (A-configuration) and increase with factor ![]() . Note that in the B-configuration map, the prominent streak that crosses the core from NE to SW across ∼3″ aligns with a spike in the point spread function (PSF), and is thus likely an artefact of the snap-shot observations.
. Note that in the B-configuration map, the prominent streak that crosses the core from NE to SW across ∼3″ aligns with a spike in the point spread function (PSF), and is thus likely an artefact of the snap-shot observations.
Current usage metrics show cumulative count of Article Views (full-text article views including HTML views, PDF and ePub downloads, according to the available data) and Abstracts Views on Vision4Press platform.
Data correspond to usage on the plateform after 2015. The current usage metrics is available 48-96 hours after online publication and is updated daily on week days.
Initial download of the metrics may take a while.