Fig. 11.
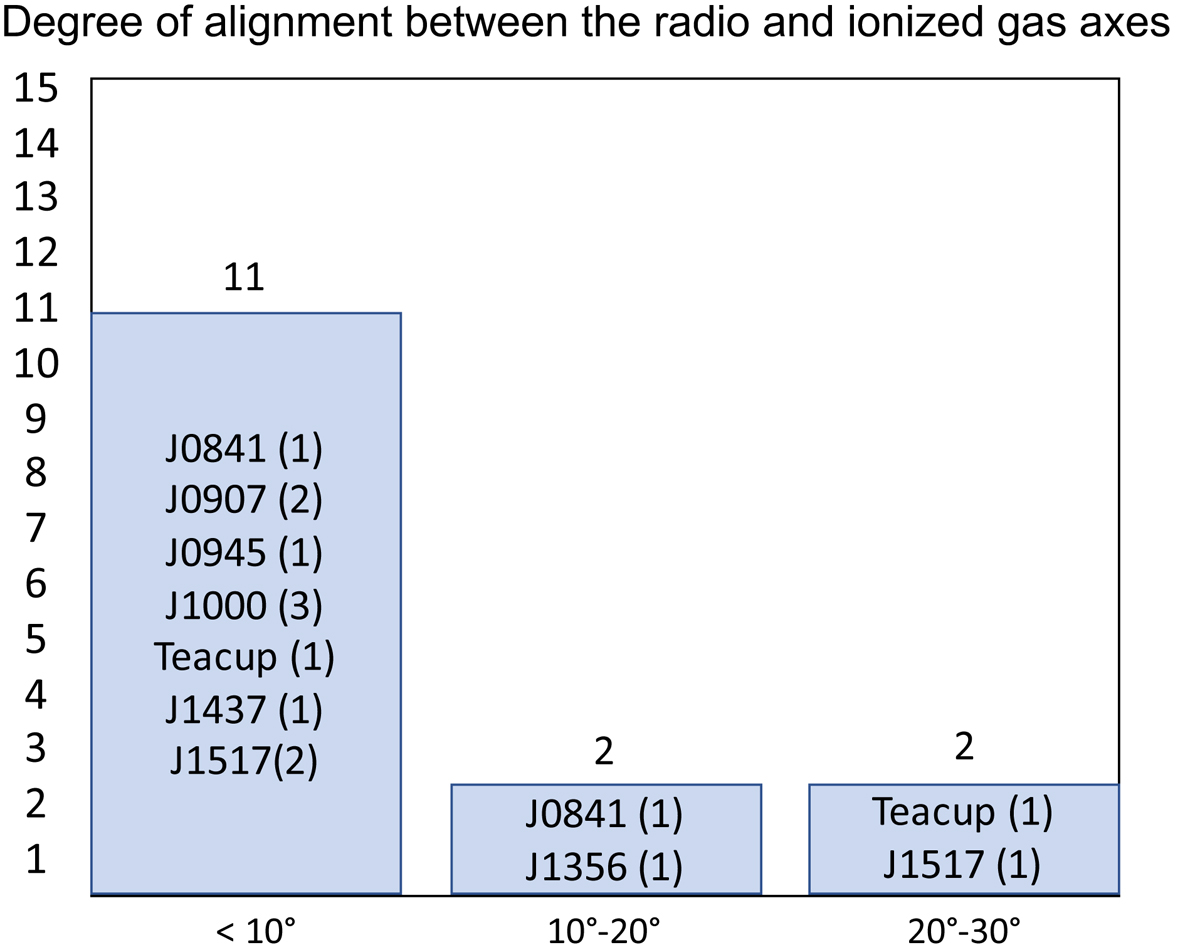
Relative angles ΔPA = |PArad − PAopt| between the radio and ionised gas axes measured in the eight QSO2 indicated in this plot (see text). They have been grouped in three bins according to ΔPA < 10°, 10° ≤ΔPA < 20° and 20 ≤ ΔPA < 30°. For each object, the number of radio-Hα angles in that specific bin is shown in brackets. The radio and gas axes are in general very closely aligned. For seven objects (first bin), the axes are identical or almost identical (ΔPA < 10°) at least on one side of the AGN.
Current usage metrics show cumulative count of Article Views (full-text article views including HTML views, PDF and ePub downloads, according to the available data) and Abstracts Views on Vision4Press platform.
Data correspond to usage on the plateform after 2015. The current usage metrics is available 48-96 hours after online publication and is updated daily on week days.
Initial download of the metrics may take a while.