Fig. 8.
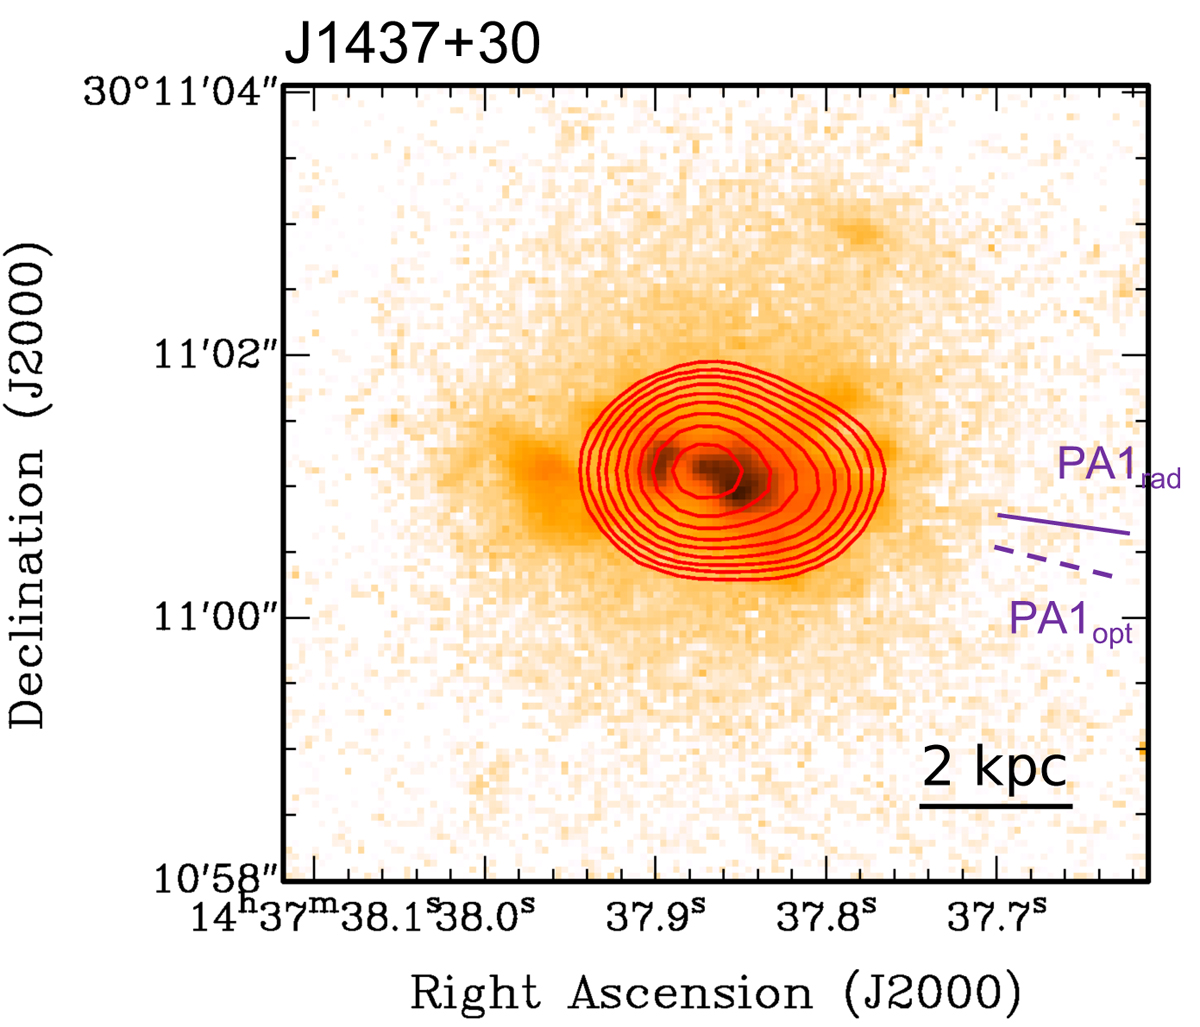
J1437+30. HST/ACS image taken with the FR551N filter (covering [OIII]λ5007) with overlaid contours of the VLA A-configuration data with super-uniform weighting from Fig. A.21. The HST image is contaminated by continuum, but the high SB features trace the ionised gas morphology accurately (Fischer et al. 2018). Radio and Hα axes as in Fig. 2.
Current usage metrics show cumulative count of Article Views (full-text article views including HTML views, PDF and ePub downloads, according to the available data) and Abstracts Views on Vision4Press platform.
Data correspond to usage on the plateform after 2015. The current usage metrics is available 48-96 hours after online publication and is updated daily on week days.
Initial download of the metrics may take a while.