Fig. A.10.
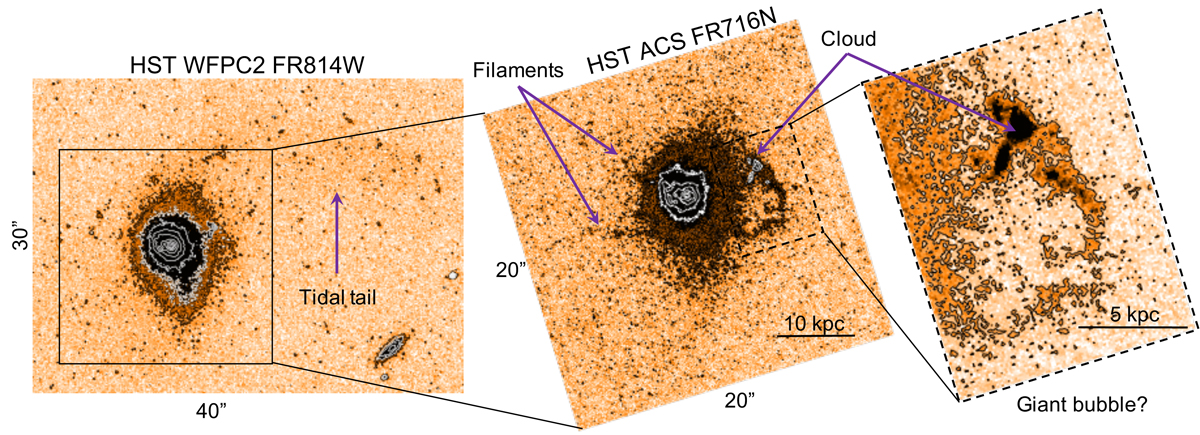
J0945+17. Left: HST WFPC F814W continuum image. This filter covers the spectral range of 7617–8921 Å (6752–7909 Å rest frame) and is thus dominated by continuum. Middle panel: HST ACS /WFC FR716N image containing Hα+[NII] (the images are not flux calibrated). It has been rotated to show N up and E left. The contours start at 3σ and increase with a factor ×2 (continuum image) and ×3 (narrow band image). The region of the cloud and the giant bubble candidate is zoomed in the right panel. The extended filamentary structures are dominated by line emission. The ‘cloud’ at ∼11 kpc to the west was identified by Storchi-Bergmann et al. (2018). It is part of a spectacular ensemble of ionised filaments whose morphology is reminiscent of a giant bubble.
Current usage metrics show cumulative count of Article Views (full-text article views including HTML views, PDF and ePub downloads, according to the available data) and Abstracts Views on Vision4Press platform.
Data correspond to usage on the plateform after 2015. The current usage metrics is available 48-96 hours after online publication and is updated daily on week days.
Initial download of the metrics may take a while.