Fig. A.13.
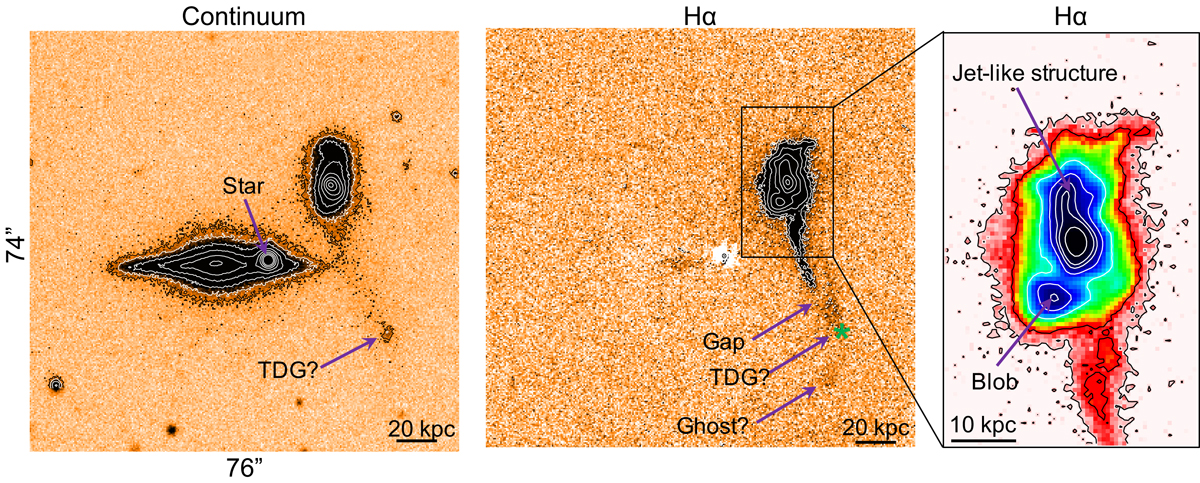
J1000+12. GTC continuum and Hα images. Contour values start at 3σ and increase with factor of two or three for the continuum and Hα images, respectively. For the Hα image, σ = 3.8 × 10⁻¹⁹ erg−1 cm−2 pixel−1. Right panel: Hα emission in a smaller region centred on the QSO2 with a different colour palette. The small green * symbol in the middle panel shows the expected location of the TDG candidate identified in the continuum image. Several additional features mentioned in the text are indicated with purple arrows.
Current usage metrics show cumulative count of Article Views (full-text article views including HTML views, PDF and ePub downloads, according to the available data) and Abstracts Views on Vision4Press platform.
Data correspond to usage on the plateform after 2015. The current usage metrics is available 48-96 hours after online publication and is updated daily on week days.
Initial download of the metrics may take a while.