Fig. A.5.
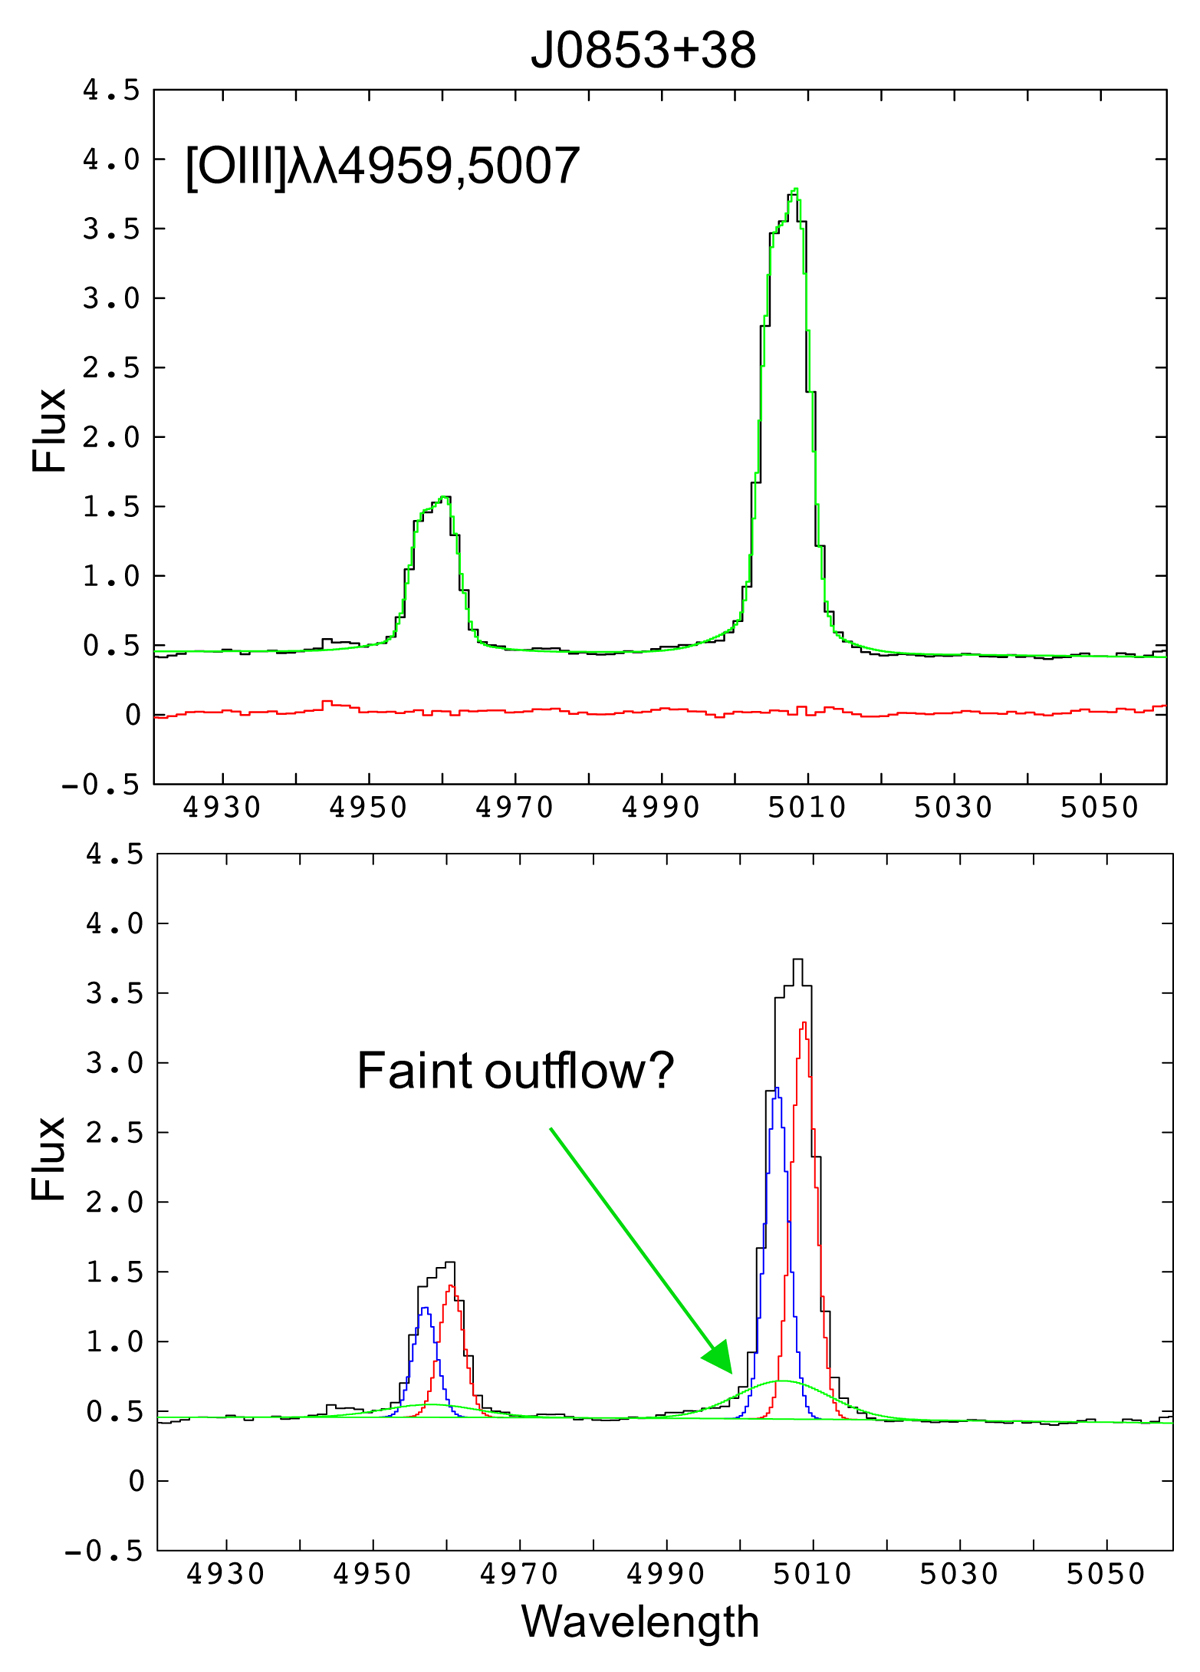
[OIII] doublet SDSS spectrum of J0853+38. Wavelength in Å. A fit (green) and residuals (red) are shown in the top panel with the data (black). The three kinematic components isolated in the fit are shown in the bottom panel with different colours. The broadest component may trace an ionised outflow, but higher S/N data is needed to confirm this. Wavelength in Å. Fluxes in units of 10−15 erg s−1 cm−2 Å−1.
Current usage metrics show cumulative count of Article Views (full-text article views including HTML views, PDF and ePub downloads, according to the available data) and Abstracts Views on Vision4Press platform.
Data correspond to usage on the plateform after 2015. The current usage metrics is available 48-96 hours after online publication and is updated daily on week days.
Initial download of the metrics may take a while.