Fig. A.2.
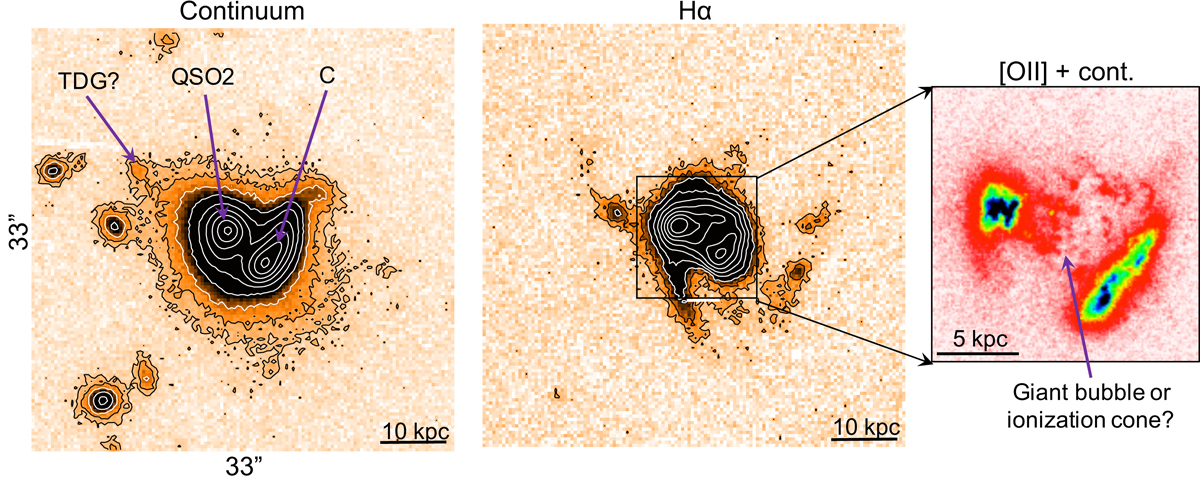
J0841+01. GTC continuum (left) and Hα images (middle). Contour values start at 3σ and increase with factor ×2. For the Hα image, σ = 4.1 × 10⁻¹⁹ erg−1 cm−2 pixel−1. QSO2 and C indicate the QSO2 and the companion galaxy. TDG is a tidal dwarf galaxy candidate (see text). The small right panel zooms in the central region of the HST WFC3/UVIS F438W image, which contains the [OII]λ3727 doublet. The intricate filamentary structures between the two galaxies are dominated by gas emission. They are reminiscent of a giant ionised bubble. In this and all figures the Hα images have been continuum subtracted. Also, N is always up and E is left.
Current usage metrics show cumulative count of Article Views (full-text article views including HTML views, PDF and ePub downloads, according to the available data) and Abstracts Views on Vision4Press platform.
Data correspond to usage on the plateform after 2015. The current usage metrics is available 48-96 hours after online publication and is updated daily on week days.
Initial download of the metrics may take a while.