Fig. 2.
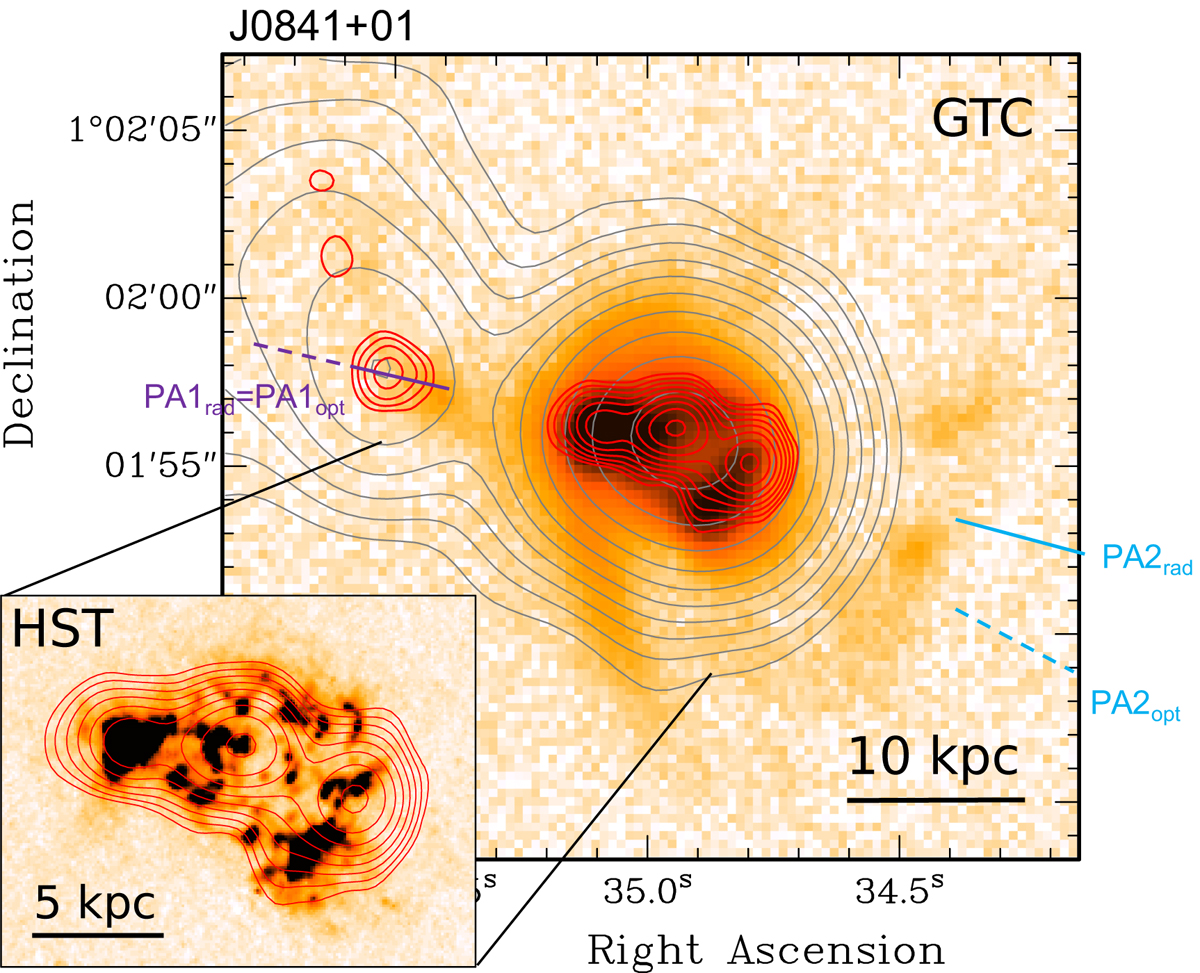
GTC Hα image of J0841+01 on a log scale, with overlaid contours of the VLA A-configuration (red) and B-configuration (grey) data. Contour levels are the same as in Fig. A.1. The inset shows the contours of the VLA A-configuration data overlaid onto the smoothed HST [OIII]λ5007 continuum subtracted image from Storchi-Bergmann et al. (2018). In these and other radio-Hα overlays, the directions of the axes used to measure the degree of alignment between the radio (solid lines) and the ionised gas (dashed lines) structures are indicated. The same colour is used for axes on the same side of the AGN (see Sect. 4.3).
Current usage metrics show cumulative count of Article Views (full-text article views including HTML views, PDF and ePub downloads, according to the available data) and Abstracts Views on Vision4Press platform.
Data correspond to usage on the plateform after 2015. The current usage metrics is available 48-96 hours after online publication and is updated daily on week days.
Initial download of the metrics may take a while.