Fig. A.15.
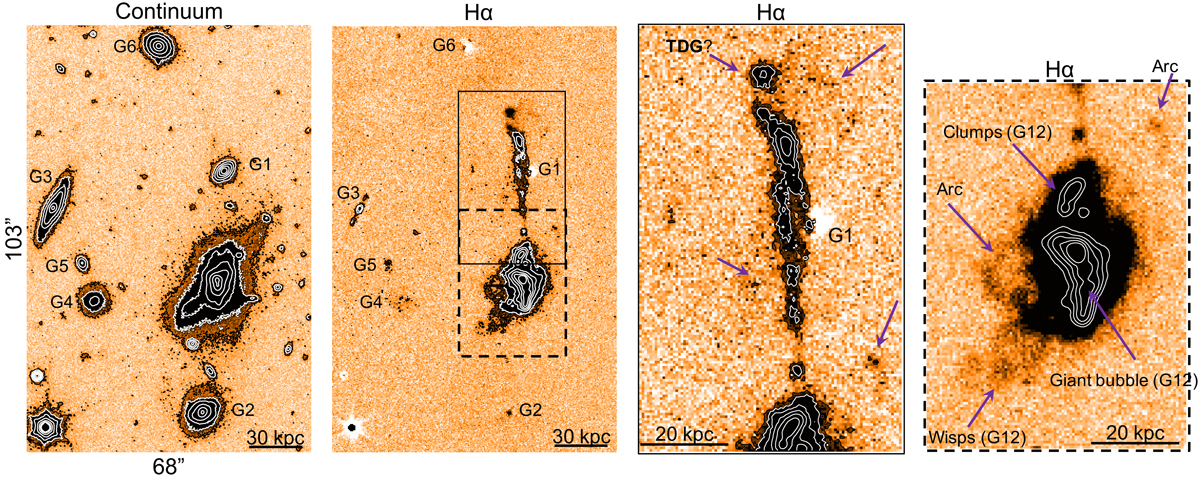
J1356+10. GTC continuum and Hα images. Contour levels in the continuum (first panel) and Hα images (second panel) start at 3σ and increase with factor ×2.5. For the Hα image, σ = 4.4 × 10⁻¹⁹ erg s−1 cm−2 pixel−1. Galaxies G1, G3, G4 and possibly G2, G5, and G6 are members of the same group as the QSO2 (see text). The rectangular areas in the second panel are zoomed in the 3th (top rectangle) and 4th (bottom rectangle) panels. The contours in these trace the morphology within the high SB regions. The purple arrows in the last panel show the location of the giant 12 kpc bubble, the clumps and wisps identified by Greene et al. (2012). Additional faint Hα features are also indicated. Ionised gas is detected up to ∼16 kpc to the east and west of the long tidal filament (third panel).
Current usage metrics show cumulative count of Article Views (full-text article views including HTML views, PDF and ePub downloads, according to the available data) and Abstracts Views on Vision4Press platform.
Data correspond to usage on the plateform after 2015. The current usage metrics is available 48-96 hours after online publication and is updated daily on week days.
Initial download of the metrics may take a while.