Fig. A.12.
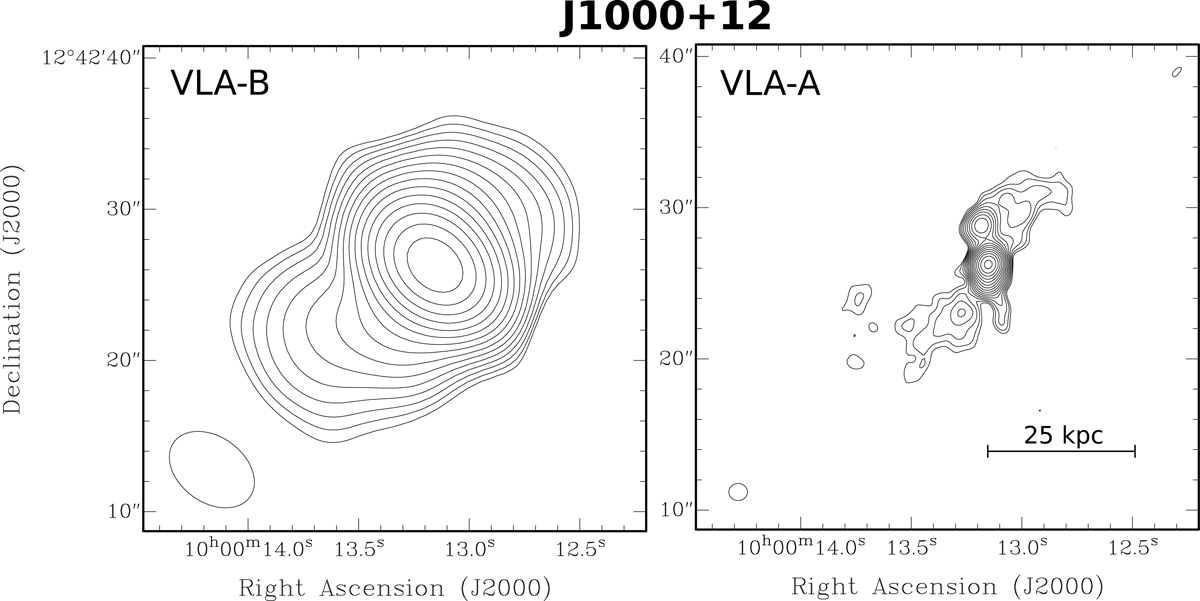
VLA radio maps of J1000+12. Same as Fig. A.1. Contour levels start at 150 μJy beam−1 (B-configuration) and 93 μJy beam−1 (A-configuration) and increase with factor ![]() . Note that the extension that stretches ∼2″ south of the core is likely dominated by artefacts of the snap-shot observations, because a spike in the prominent pattern of the Point-Spread-Function (PSF) crosses the two bright regions in the centre.
. Note that the extension that stretches ∼2″ south of the core is likely dominated by artefacts of the snap-shot observations, because a spike in the prominent pattern of the Point-Spread-Function (PSF) crosses the two bright regions in the centre.
Current usage metrics show cumulative count of Article Views (full-text article views including HTML views, PDF and ePub downloads, according to the available data) and Abstracts Views on Vision4Press platform.
Data correspond to usage on the plateform after 2015. The current usage metrics is available 48-96 hours after online publication and is updated daily on week days.
Initial download of the metrics may take a while.