| Issue |
A&A
Volume 630, October 2019
Rosetta mission full comet phase results
|
|
|---|---|---|
| Article Number | A19 | |
| Number of page(s) | 58 | |
| Section | Planets and planetary systems | |
| DOI | https://doi.org/10.1051/0004-6361/201834960 | |
| Published online | 20 September 2019 | |
Long-term monitoring of the outgassing and composition of comet 67P/Churyumov-Gerasimenko with the Rosetta/MIRO instrument
1
LESIA, Observatoire de Paris, PSL Research University, CNRS, Sorbonne Université, University Paris Diderot, Sorbonne Paris Cité,
5 place Jules Janssen,
92195
Meudon,
France
e-mail: nicolas.biver@obspm.fr
2
JPL/California Institute of Technology,
4800 Oak Grove Dr.,
Pasadena,
CA
91109,
USA
3
University of Massachusetts, 619 Lederle Graduate Research Tower,
Amherst,
MA, USA
4
Max Planck Institut für Sonnensystemforschung,
Justus-von-Liebig-Weg 3,
37077
Göttingen,
Germany
5
National Central University,
Jhongli,
Taoyuan City
32001,
Taiwan
6
LERMA, Observatoire de Paris, PSL Research University, Sorbonne Université, CNRS,
61 avenue de l’Observatoire,
75014
Paris,
France
Received:
21
December
2018
Accepted:
1
March
2019
We present the analysis of ≈100 molecular maps of the coma of comet 67P/Churyumov-Gerasimenko that were obtained with the MIRO submillimeter radiotelescope on board the Rosetta spacecraft. From the spectral line mapping of H216O, H218O, H217O, CH3OH, NH3, and CO and some fixed nadir pointings, we retrieved the outgassing pattern and total production rates for these species. The analysis covers the period from July 2014, inbound to perihelion, to June 2016, outbound, and heliocentric distances rh = 1.24–3.65 AU. A steep evolution of the outgassing rates with heliocentric distance is observed, typically in rh−16, with significant differences between molecules (e.g. steeper variation for H2O post-perihelion than for methanol). As a consequence, the abundances relative to water in the coma vary. The CH3OH and CO abundances increase after perihelion, while the NH3 abundance peaks around perihelion and then decreases. Outgassing patterns have been modeled as 2D Gaussian jets. The width of these jets is maximum around the equinoxes when the bulk of the outgassing is located near the equator. From July 2014 to February 2015, the outgassing is mostly restricted to a narrower jet (full width at half-maximum ≈80°) originating from high northern latitudes, while around perihelion, most of the gaseous production comes from the southernmost regions ( − 80 ± 5° cometocentric latitude) and forms a 100°–130° (full width at half-maximum) wide fan. We find a peak production of water of 0.8 × 1028 molec. s−1, 2.5 times lower than measured by the ROSINA experiment, and place an upper limit to a 50% additional production that could come from the sublimation of icy grains. We estimate the total loss of ices during this perihelion passage to be 4.18 ± 0.18 × 10⁹ kg. We derive a dust-to-gas ratio in the lost material of 0.7–2.3 (including all sources of errors) based on the nucleus mass loss of 10.5 ± 3.4 × 10⁹ kg estimated by the RSI experiment. We also obtain an estimate of the H218O/H217O ratio of 5.6 ± 0.8.
Key words: comets: general / comets: individual: 67P/churyumov-Gerasimenko / radio lines: planetary systems / submillimeter: planetary systems
© N. Biver et al. 2019
 Open Access article, published by EDP Sciences, under the terms of the Creative Commons Attribution License (http://creativecommons.org/licenses/by/4.0), which permits unrestricted use, distribution, and reproduction in any medium, provided the original work is properly cited.
1 Introduction
Comets are the most pristine remnants of the formation of the solar system 4.6 billion years ago. Understanding their composition and the sublimation process of their ices as they heat up approaching the Sun was one of the main objectives of the Rosetta mission of the European Space Agency to comet 67P/Churyumov-Gerasimenko (67P). Comet 67P is a Jupiter-family comet that reached perihelion on 13.1 August 2015 UT at 1.24 AU from the Sun. After a ten-year-long journey in the solar system, the Rosetta spacecraft reached (at a distance to the comet of <100 km) comet 67P on 6 August 2015, at 3.6 AU from the Sun. It entered into orbit or escorted the nucleus of comet 67P from a 5–1400 km distance until 30.5 September 2016, when Rosetta terminated its operations at the surface of the comet, at 3.83 AU from the Sun (Accomazzo et al. 2016, 2017).
The Microwave Instrument for the Rosetta Orbiter (MIRO) is a submillimeter radiometer equipped with two continuum channels at 188 and 562 GHz and a high spectral resolution (44 kHz) heterodyne spectrometer working in frequency-switching mode (Gulkis et al. 2007). MIRO acquired about two million spectra during its operation atthe comet. Four molecules were targeted through their rotational lines in the 548–579 GHz range: H2O, CH3OH, CO, and NH3. In addition to H O, H
O, H O and H
 O were observed to handle the frequently occurring saturation of the main isotopic species. For methanol, three lines were observed to measure therotational temperature.
First results on the MIRO observations of water in early June and August 2014 were published by Gulkis et al. (2015). Biver et al. (2015) analyzed a map of the water lines obtained on 7 September 2014, at 3.41 AU from the Sun. Lee et al. (2015) presented a study of the diurnal variations of the water lines observed in August 2014at rh = 3.60–3.52 AU. Marshall et al. (2017) provided an analysis of the water production rate evolution from August 2014 until April 2016, covering an rh range of 3.62–1.24 AU, based on MIRO nadir observations that sampled the local outgassing.
We analyze here dedicated mapping observations acquired by slewing the Rosetta spacecraft. These observations were spread over the two years of the Rosetta mission. They provide information along the three dimensions, including the (X,Y) mapping coordinates and along the line of sight (Z). The Z axis data are provided by the spectral line resolved velocity information, obtained with the high-resolution spectrometer.
Hundreds of raster maps were acquired with sampling and scanning speed adapted to different objectives: (1) mapping the nucleus and near coma (e.g., Biver et al. 2015), (2) mapping the coma with a scanning speed adapted to the MIRO acquisition duration, or (3) faster mapping of the coma appropriate to the high-resolution channel of the Visual IR Thermal Imaging Spectrometer (VIRTIS-H). In addition, sequences sampling a few positions in the coma (coarse maps) were performed. In Table A.1 we list the MIRO maps and coarse maps considered in this paper. A full analysis has been performed for three quarters of these maps.
Section 2 describes the observations and the data reduction and calibration. Section 3 describes the model we used to interpret the data and how the expansion velocity and gas temperature were obtained. Section 4 is a step-by-step description of our map analysis. Section 5 presents a discussion of the errors that result from modeling approximations. Section 6 discusses some of the individual maps. In Sect. 7 we make use of nadir observations to derive longitudinal averages of the production rates as a function of the cometocentric latitude. In Sect. 8 we investigate the possible contribution of distributed sources of water in the coma. Section 9 presents a determination of the H O/H
O/H O ratio. Section 10 presents the long-term evolution of the outgassing rates and relative production rate ratios. We also provide the cumulative mass loss of volatiles by the comet. We compare the results with measurements from other instruments. Section 11 concludes with a summary of the results. The processed data (maps and plots) are contained in the appendices.
2 Observations
2.1 Mapping of submillimeter lines
The MIRO instrument operated as a single-beam submillimeter radiotelescope mounted rigidly on the Rosetta spacecraft. The pointing axis was aligned with the + Z axis of the spacecraft, as were most of the other remote-sensing instruments (Koschny et al. 2007). During the entire Rosetta observation period, MIRO operated continuously, mostly in “CTS/dual-continuum” mode (Gulkis et al. 2015). In this mode, frequency-switched spectra at wavelengths ~0.53 mm were acquired every 30 s, and continuum measurements at 0.53 and 1.6 mm wavelengths were obtained every 50 ms. Spectra were obtained with a chirp transform spectrometer (CTS). In some periods, the data rate available to transmit data to the Earth was limited. The data volume was then reduced by averaging spectra or continuum measurements on longer timescales and eventually smoothing the spectra to reduce the number of channels. The beam width at 560 GHz is 7.5′. As the instrument has a single beam, it was necessary to slew the whole spacecraft over a larger field of view in order to obtain spatial information. The slew rate minimized smearing during individual integrations times. Values from 15 to 30′ per minute wereused for MIRO spectral maps.
Table 1 lists the lines of H O, H
O, H O, H
O, H O, CH3OH, NH3, and CO that are observed in MIRO spectra. Although carbon monoxide is a relatively abundant species, observing it with MIRO was much more difficult than were observations for the other molecules. It only showed up well in periods of high activity because the rotational lines of this molecule are weak since CO has a small dipole moment, and because the MIRO spectrometer could only observe the CO J(5 − 4) line, a transition between relatively high rotational energy levels.
Table A.1 provides the list of the maps we analyze here, together with their characteristics. Their sizes range from 2° to 30° (~4 to 45 km considering the distance to the comet). They were typically acquired in 4 h, which corresponds to about one-third of the rotation period of the comet of ≈12 h. Figure 1 shows examples of scanning schemes with measured line intensities. The maps shown in Appendix B (Figs. B.1–B.14 for H O and Fig. B.15 for H
 O) were interpolated for better visualization. For the analysis, however, we used the spectra at their mean locations.
In addition, discrete point-by-point spatial maps were also obtained without a continuous slewing, but still regularly sampling the coma. These were made in periods of low comet activity.
The geometric data provided with the observations were used to compute the coordinates of each observation and the pointing offset relative to the nucleus in the J2000.0 RA/Dec frame. From the RA/Dec coordinates of the spin axis of the comet (Jorda et al. 2016) and the coordinates of the Sun from 67P provided by the JPL Horizons tool (Giorgini et al. 2018), we computed the projected position angle (PA) in the plane of the sky and the aspect angles (Rosetta–comet–north pole and Rosetta–comet–Sun) for the north pole and the Sun directions. Because all maps were made by scanning along the Sun-comet projected vector (Fig. 1), we rotated all maps so that the Sun direction was either to the left (PA = 90°) or right (PA = 270°). All pointing offsets were further converted into kilometers relative to the center of 67P.
Lines observed by MIRO.
 |
Fig. 1 Examples of schemes used to scan the coma of 67P with Rosetta/MIRO. Each circle has the projected size of the MIRO beam width (7.5′) at the distance of the comet and is projected at the pointed position at the center of the 30 s integration. The scales of the
X- and Y -axes are the distance from comet center. Arrows show the scanning direction and its motion during 30 s. The color provides the H |
2.2 Reduction and calibration of the MIRO data
The MIRO f0 = 562 GHz submillimeter local oscillator frequency is switched by ±Δf = 5 MHz every 5 s. The 30 s CTS spectra consist of the average of three pairs of f+ (= f0 + Δf) − f−(= f0 − Δf) frequency-switched spectra (Gulkis et al. 2015). A calibration was performed to determine the gain of the receiver every ~30 min by observing a hot load, a cold load, and the sky in sequence, each for 30 s. A motor-driven flip mirror mounted on the optical bench provides theswitching motion. These calibration data were obtained separately for each local oscillator frequency f+ and f−. We used spline fitting over 6 h (continuum mode) to 36 h (spectral mode) to calibrate continuum measurements (separately for each frequency) and spectral data in each sub-band of the CTS. Further information on the calibration may be found in Schloerb et al. (2015). We list the additional corrections that were applied below.
- 1.
Beam efficiency correction ηb = 0.94 to convert antenna temperatures
 into main beam brightness temperatures
  . This value was suggested by Schloerb et al. (2015) based on measurements obtained before flight. The beam was described as a main beam of Gaussian profile with a full width at half-maximum FWHM [″] = 456 × (562.8∕ν (GHz)), and an additional error beam containing 3% of the signal that was ten times broader. This is within 1% of the values determined from the MIRO flight model on ground with an assumed
1∕ν
frequency dependency. This beam efficiency correction was applied to spectral and continuum measurements.
 - 2.
Side-band gain correction gcl = 1.12 for spectra obtained in the lower side band (f < f0, i.e., the water lines and one line of CH3OH) and gcu = 0.90 for the upper side band (i.e., NH3, CO, and two CH3OH lines). In previous publications and archived data, the side-band gain ratio was assumed to be 1.0. It was not precisely measured before flight, but deviations by more than 10% were not excluded. When the saturated part (channels around − 0.8 km s−1) of the H
 O line is considered, the intensity Tem, measured against the blank sky, is expected to be equal to the intensity Tbg − Tabs
measured in absorption in front of the thermal radiation of the nucleus (see, e.g., Fig. 2), but this is not observed. Whereas the continuum background temperature
 (1)
(1)originates from the two side bands and does not depend on the side-band gain ratio gu∕gl because gu + gl = 2.0, the line intensity does depend on the side-band ratio, for instance, Tem(measured) = glTem for a line in lower side band. Based on a large set of saturated H
 O lines around perihelion, we determine the side-band gain gl
so that
 (2)
(2)is satisfied. We found gl = 0.89 (gc_l = 1∕gl = 1.12) and gu = 1.11 (gc_u = 1∕gu = 0.90). We used the same correction for all MIRO bands. After applying the side-band correction, saturated H
 O profiles in limb and nadir sounding present consistent intensities at negative velocities, as illustrated in
Fig. 3. We note that the CH3OH(8+1–70E) line, observed in lower side band, is always weaker than expected in comparison to the CH3OH(3−2–2−1E) and CH3OH(12−1–11−1E) lines that are observed in upper side band. After applying the side-band correction, the discrepancy is reduced, although the production rates derived from the different methanol lines suggest that a larger correction would be needed.
The 30 s average continuum values were added as ancillary data to each spectrum. They were used to analyze the absorption spectra that were obtained in nadir viewing (Sect. 7).
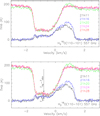 |
Fig. 2 Spectra of H |
 |
Fig. 3 Intensity measured at − 0.8 km s−1 on saturated H |
3 Modeling approach
Before describing the step-by-step process we employed to derive the outgassing pattern and total production for each molecule based on the maps, we describe below the geometrical approach of the problem, the excitation and radiative transfer codes we used to compute line profiles and intensities. We also describe how we derived two key parameters for these codes, the gas expansion velocity and temperature.
3.1 Definition of parameters and model
In Table 2 we list all the variables introduced in this paper with their units and definition. We have modeled the comet outgassing as the superposition of an isotropic component and a jet-like component with a Gaussian distribution,
 (3)
(3)
Here qI is the isotropic production rate per solid angle, qJ is the peak production rate per solid angle in the jet, and θJ is the FWHM of this Gaussian jet.
Figure 4 illustrates the main geometrical parameters of the jet, represented in this figure as a simple cone.
List of variables.
 |
Fig. 4 Geometric parameters defining the jet and its appearance on the plane of the sky, defined by the Rosetta X- and Y-axis. The +Y direction is closest to the north pole and the Sun is either in the +X or -X direction (PA = 90° or 270°). |
3.2 Excitation and outgassing pattern model
We used the excitation and radiative transfer codes described in previous studies (Biver et al. 2015, 2012; Zakharov et al. 2007), which take into account collisions with neutrals and electrons, radiative decay, and infrared pumping of the rotational levels. The line opacity was taken into account for the excitation using the escape probability formalism. The rotational populations were derived for each distance r to the nucleus with a time evolution linked to the distance through the radial expansion (r(t) = ∫ vexp(r)dt). Collisional excitation depends on the gas temperature T(r) as determined hereafter. The computations started at a radius r = 2 km, and all parameters (relative populations, gas temperature, and expansion velocity) were assumed to have the same value for r < 2 km as for r = 2 km. For collisions with water molecules, we used total cross sections of 5 × 10⁻¹⁴ cm2 for methanol and water, and 2 × 10⁻¹⁴ cm2 for ammonia and CO.
After the rotational populations were computed, radiative transfer was solved by performing a numerical integration (with adaptive steps) along the line of sight and over the main beam solid angle. Optical depth effects are thus fully considered for each transition. The pointing offset relative to the direction of the center of the nucleus was taken into account as well as the contribution of the continuum emission from the nucleus (and hidden background gas), when parts of the nucleus were in the beam. The observed continuum background was adjusted to the observed value.
In the radiative transfer model, a jet-like outgassing pattern was considered by restricting the outgassing in a region defined by a range in θ and ϕ angles: q = qJ if ϕ2 < ϕ < ϕ1 and 0 < θ < θm, where θ (azimuth) and ϕ (colatitude) are spherical coordinates centered on the comet. The corresponding solid angle is Ω =2θm(cos(ϕ1) − cos(ϕ2)), with θm < π. When we fit the data, the θm, ϕ1, ϕ2 parameters were adjusted so that this synthetic jet was close to the observed one: same direction, similar jet widths θϕ and θaz in the plane of the sky and along the line of sight, and same solid angle Ωjet. The populations of the rotational levels only depend on the distance to the comet center r.
3.3 Determination of the gas expansion velocity
A first estimate of the gas expansion velocity was obtained from line profiles seen in absorption against the thermal emission of the nucleus in nadir pointing. Examples of these lines are provided in Fig. C.1. The absorption peak seen in the lines is at the Doppler velocity of the bulk of the molecules moving toward the spacecraft, which is the terminal expansion velocity vexp(r = ∞). Close to the surface, the gas is accelerated and vexp(r) increases quickly. Rotational lines from high-energy levels (CO(5-4) and CH3OH(12−1–11−1E)) are formed closer to the surface (where the gas temperature is higher) and tend to show lower Doppler velocity values at the absorption peak. To simplify the calculation and limit the number of free parameters, we assumed a constant vexp, especially as acceleration only affected the very first kilometers from the surface. A moderate variation of about + 10% between r = 3 and 10 km was taken into account when necessary for the high activity phase around perihelion, however.
The expansion velocity along the line of sight can be different from the gas velocity in the plane of the sky or along the jet axis. We have little constraint on the velocity perpendicular to the line of sight. Some observations (e.g., when the line of sight in nadir pointing was close to the jet axis) suggest little variation within the jet. vexp might be 10% higher in the densest part of the jet, but this does not significantly affect the retrieved production rates. When we inverted the line profiles, we iteratively adjusted vexp to achieve reasonable agreement between the simulated line profile and the feet of the lines, which correspond to molecules moving close to the line of sight (see, e.g., top of Figs. 10 and 11). The values we used are provided in Table A.2 and plotted in Fig. 5. For comparison we show the velocity profile adopted by Hansen et al. (2016) and Läuter et al. (2019) for water. We note that we used the same expansion velocity for all molecules as we do not see evidence of difference in velocity (e.g., due to their mass) between molecules, but the lower expansion velocity measured post-perihelion beyond 2 AU could be due to mass load by CO2, which is more abundant in the coma (Läuter et al. 2019).
 |
Fig. 5 Mean gas expansion velocity measured for the jet as given in Table A.2. These values were used to invert the lines profiles and compute production rates for all molecules. Filled blue dots show pre-perihelion data and empty black symbols represent post-perihelion observations. The fitted power laws are
|
 |
Fig. 6 Example of a radial profile of the rotational temperature Trot(CH3OH) as a functionof projected distance ρ
from the nucleus in the jet (see text). The empty circles correspond to the entire line profile, and the blue, green, black, red, and pink dots correspond to rotational temperatures measured in bins of Doppler velocity of
(−V ; −0.6V),
(−0.6V ;−0.2V),
(−0.2V ;+0.2V),
(+0.2V ;+0.6V), and (+0.6V ;+V), respectively, where V is either the average expansion velocity or half the FWHM of the line. Each velocity bin samples gas either closer to (vi < 0) or farther away (vi > 0) from the plane of the sky, i.e., at a cometocentric distance r
larger than the projected distance ρ:
r
= |
3.4 Gas temperature profile T(r)
We have estimated the kinetic temperature profile T(r) as a function of the radial distance r from the center of the nucleus using constraints from the rotational temperature of methanol and the peak brightness temperature of the saturated H O line.
3.4.1 Rotational temperature of the methanol lines
We used the two rotational lines of methanol observed in the same side band: CH3OH(3−2–2−1E) and CH3OH(12−1–11−1E). The third line, CH3OH(8+1–70E), suffers fromcalibration issues (see Sect. 2.2), and was not used for this study. Because the sampled columns are the same, the rotational temperature Trot(CH3OH) can be readily derived from the intensity ratio of the two lines using well-known spectroscopic parameters: the energy of the levels, their statistical weights, and Einstein coefficients. In the inner coma, which is dominated by collisions, we expect methanol to be at local thermal equilibrium (LTE). For optically thin lines, the rotational temperature should then correspond to the gas temperature. Based on radiative transfer calculations, we verified that these conditions are reached for all the Trot(CH3OH) values.
Even at the activity maximum of the comet, the signal-to-noise ratio (S/N) of the CH3OH(12−1–11−1E) line was still insufficient to obtain a full map of Trot(CH3OH). However, byaveraging the signals over an angular sector and a range of radial offsets from the nucleus, we were able to derive the radial profile of Trot(CH3OH) as a function of the offset ρ. For additional spatial information, we divided the lines into five velocity bins corresponding to different velocity directions and distances, providing us with measurements of Trot(CH3OH) at different radii r (r = ρ∕cos(ψ) with sin (ψ) = v∕vexp, see Fig. 7).
3.4.2 Temperature from the saturated water line
Simulation of line profiles at radial offset ρ shows that when the H O line is saturated, the main beam brightness temperature Tp (H
 O) at velocity channels vi = +0.5 ± 0.2 km s−1 corresponds to the peak intensity of the line within 1 K, and at first approximation probes the gas temperature at the distance ρ. Simulations were made for the range of production rates and radial offsets appropriate to the MIRO observations we analyze here. In addition, in nadir and limb viewing, the main beam brightness temperature measured in the velocity channel at vi = −vexp should correspond to the gas temperature close to the spacecraft T(Δ).
Collisions with electrons may affect the temperature retrieval when collisions between neutrals are low, that is, when the water production rate is low. For high production rates ( molec. s−1 sr−1), this is only significant at distances >100 km. We found that for lower production rates, water excitation is less affected by electron collisions because of the lower electron densities, and T(H
 O) can be only up to 5 K higher than the gas temperature. The effect of collisions with electrons could have been observed in the maps by an increase in Tp (H
 O) at some distance, and also by an increase in brightness temperature at the channels around vi = −vexp (sampling the spacecraft region). However, the observations show no evidence for such an enhancement, suggesting a relatively low electron density that is consistent with the electron density scaling factor xne = 0.2 we used (Zakharov et al. 2007). At the end of the mission (30 September 2016, rh = 3.8 AU), the Rosetta Plasma Consortium experiments were able to measure the ion density between 20 km and the surface of the comet (Heritier et al. 2017). The density roughly follows n = 650∕r between r = 16 and 5 km from the center of the comet. From our estimated water production rate (1.2 × 1024 molec. s−1 in π steradians) and expansion velocity (0.45 km s−1) determined on 27 September 2016, our modeled (cold) electron density close to the nucleus Zakharov et al. (2007; where it is proportional to 1∕r) yields ne (r) ≈ 2400∕r, using xne = 0.2. This is somewhat higher than the observed value, but low enough to affect the excitation of water in no great way; therefore it is compatible with observations. Unfortunately, there are few or no (in situ) RPC observation of ion or cold electron densities for higher activity in the regions we probe with MIRO observations.
3.4.3 Temperature profile
Corrections were made to convert the above retrieved temperatures into gas temperature radial profiles T(r). The main-beam brightness temperature Tp (H O) corresponds to the Rayleigh-Jeans approximation of the blackbody radiation, which is slightly lower than the blackbody temperature. The correction required to obtain a physical temperature at the distance r, taking into account that part of the signal comes from the side lobes, is
 (5)
(5)
We described the temperature profile T(r) by the law a + b∕r that best fits the measurements obtained for Trot(CH3OH)(r) and T(H O)(r). Figures 6 and 7 show an example of radial profiles of Trot(CH3OH), Tp (H
 O), and T(r). The values for T(r) are provided in Table A.2. Maps of Tp (H
 O) (measured at the Doppler velocity ~+0.2–0.6 km s−1) are also shown in Fig. C.1.
In the higher density part of the coma we generally achieve a good fit of the data with the law T(r) = a + b∕r, the decrease as 1∕r being expected from adiabatic cooling. On the night side, T(H O)(r) quickly stops to decrease with 1∕r, likely because of inefficient adiabatic cooling (and possibly because of some warming by gas-decoupled hot electrons). We therefore obtain a warmer temperature profile for the low-density part of the coma, as is shown in several temperature maps of Appendix C, where the “warm” gas on the night side is more localized in the low-density anti-jet direction than in the anti-sunward direction.
To analyze nadir observations, we have limited constraints on the temperature profile along the line of sight. We assumed a 1∕r profile as above, constrainingthe a and b parameters from two measurements: (1) the temperature near the spacecraft T(Δ), which is derived from the H O line profile at the velocity channel vi = −vexp (see above); for low activity cases, this value will be an upper limit to T(Δ); (2) the other constraint is from the maximum intensity at positive velocities, which is close to the background temperature Tbg of the nucleus and provides a constraint on the gas temperature near the surface.
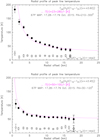 |
Fig. 7 Top panel: example of a radial profile of the peak intensity Tmb
of the saturated H |
 |
Fig. 8 Illustration of step 1 of the data analysis: azimuthal cut of the 14.31–14.44 September 2015 UT map of H |
4 Conversion of the 3D maps into a 2D outgassing pattern
4.1 Method
The maps of the various molecular lines obtained with the MIRO spectrometer contain 3D information on the outgassing pattern: 2D spatial information in the plane of the sky (in X and Y directions defined by the Rosetta platform axis, with the Z-axis corresponding to the comet-Rosetta axis), plus Doppler velocity information. This velocity information can be converted into spatial information along the Z-axis because the Doppler velocity components of the line are the result of the projection on the line of sight of the velocity vector. We used spherical coordinates defined by the azimuthal angle PA (equal to 0° along the vertical +Y -axis) and the colatitude angle ϕ (Table 2 and Fig. 4). The various steps undertaken to derive information on the outgassing pattern and outgassing rate of each molecule are listed below.
- 1.
Extract azimuthal cuts of the line intensity from the maps. We used steps of 2.5 km × 15° (20° for methanol or ammonia, depending on the S/N). An example is shown in Fig. 8.
- 2.
Fit a Gaussian profile to the azimuthal variation of the line area A(PA) for each radial distance to derive the projected main direction of the outgassing (PAjet), the projected angular width of the jet θproj from the FWHM of the Gaussian, the peak line area Ap, and the background value A0, with
 (6)
(6)Then, the average values ⟨PAjet⟩ and ⟨θproj⟩ over the different radial distances were computed.
- 3.
Average all the on-nucleus (nadir) integrations for each line when available. We generally selected observations with a background continuum level higher than 130–160 K, depending on the average submillimeter continuum level around that date. When too few integrations on the nucleus were available during the mapping, we considered those obtained between two consecutive maps of the same day or just before or after. The line-integrated area measured in absorption was converted into an outgassing rate per solid angle (qnadir = q(ϕ = 0)).
- 4.
Extract line profiles along the jet axis for a range of radii (step of 2.5 km, r > 2.5 km). We averaged spectra within PA = PAjet ± 30°, and within PA = (PAjet + 180°) ± 30° (i.e., in the “night” side). This provided us with information on the distribution of the molecules within the jet as a function of the colatitude ϕ. Examples are shown in Fig. 9.
- 5.
In this step we performed what we call an “inversion” of the line profile to convert the intensity profile Tmb(vi) into a production rate (per solid angle) profile q(ϕ). From simulated line profiles obtained using derived vexp and T(r) for both the jet and the night side (Sect. 3), the extracted line profiles were inverted into outgassing rate per solid angle q(ϕ) as a function of the colatitude angle ϕ in the plane defined by the Z-axis and jet main axis (with 0 < ϕ < 180° on the jet side and 180 < ϕ < 360° on the night side). For radial flow at a constant velocity vexp, each velocity channel vi of the line approximately corresponds to gas that expands in the direction ϕi so that vi = vexp cos(ϕi). Simulations show that as a result of thermal broadening, the contribution for each projected velocity spreads over 0.37 to 0.43 km s−1 (FWHM), which is taken into account for the inversion. Angular production rates qi(ϕ) derived from nearby channels are thus correlated. First-order non-linearity due to opacity is also taken into account. The estimated noise on each line channel is used to estimate the uncertainty on the derived values. Figures 10–12 show the step-by-step process on one example of spectrum.
- 6.
For each range of radial distances, a Gaussian shape was fit to the q(ϕ) profiles to derive the following four parameters: qI,ϕ (background level of the Gaussian, corresponding to the isotropic component of the outgassing), qp (peak value of q(ϕ)), ϕJ (direction of the maximum), and θϕ (the FWHM). An example of the results is shown in Fig. 13. Because the signal was generally averaged over 60° in azimuth,the true peak outgassing rate needed to be corrected: qJ,ϕ = qp∕0.93 for a Gaussian distribution with FWHM ≈ 105° (the exact correction was computed according to the actual θproj). Then, a weighted (according to error bars) average was computed over the various radii. In the absence of distributed sources of gases or significant time variability, the four parameters, qJ,ϕ, qI,ϕ, ϕJ and θϕ should not depend on the radii.
- 7.
We can now use ⟨ϕJ⟩ to correct the effect of projecting a 2D Gaussian on the plane of the sky. From the derived Gaussian-like profile A(PA; Eq. (6)), and the angle with the line of sight ⟨ϕJ⟩, we determined the real width of the Gaussian θaz and the effective contributions AJ and AI (AJ + AI = Ap + A0) of the jet and isotropic components to the signal. We used a code that computes the projection of a 2D Gaussian and provides the correction factor ϵ needed to compute
 .
. - 8.
The solid angle Ωjet of the jetis then computed using its average FWHM:
 . We found values of Ωjet ranging from 0.5 to 1.5π. Uncertainties on the determined θ angles were propagated to Ωjet and to the total production rate in the jet QJ.
 - 9.
We used our 1D radiative transfer code to simulate this jet (Sect. 3.2) taking into account the orientation ⟨ϕJ⟩ of the jet with respect to the line of sight. This allowed us first to check that the mean Doppler shift of the line was well reproduced (especially for weak lines for which the determination of ⟨ϕJ⟩ was not possible, such as the H
 O line). This simulation was used to convert AJ into outgassing rate qJ,az. Ω was chosen as close as possible to the measured Ωjet to avoid misestimating qJ,az. The comparison with qJ,ϕ generally confirms this. The isotropic component qI,az was also derived from AI. The assumption that the total outgassing is the sum of two components (jet + isotropic) holds as long as opacity effects are not too high to depart from the linear domain. In most cases, however, the previous correction step shows that AI is generally much closer to 0 than to A0, hence that most of the outgassing is contained in a Gaussian-like jet. In the case of strong opacity effects (e.g., H
 O on 29 July 2014), we simply considered the “isotropic” component only outside the jet (in 4π − Ωjet steradians instead of 4π) and used the whole line intensity inside the jet to compute the production rate inside the jet to avoid non-linearity problems. We then averaged over the various radii to obtain ⟨qI,az⟩ and ⟨qJ,az⟩.
 - 10.
The last step is to consider the two perpendicular components (az and ϕ) to derive the average global values: the peak outgassing rate per solid angle in the jet,
 (7)
(7)
The process described above can be applied as long as the S/N allows for H O, CH3OH, and CO, but the line inversion is difficult for NH3 and H
 O because of their hyperfine structure (Table 3, see examples of spectra in Fig. C.1). Details on the inversion of the NH3 line are given in Sect.4.2.
Values of the total production rates Q, production rates within the Gaussian jet QJ and in the isotropic component QI are provided in Table A.3. The formal uncertainties are 1σ: they are based on the weighted average of measurements of q at different nucleus distances, and the (quadratic) sum of the uncertainties on each component (isotropic and jet production rate) and on the jet solid angle. The uncertainty on Q might appear larger than Q itself in some case although the line is clearly detected in the jet part. The decomposition of signal into two contributions from a jet and isotropic outgassing might bring a large uncertainty as a result of the undetected isotropic contribution in such cases. For detections with a low S/N, considering only the jet contribution and its uncertainty can yield a more realistic estimate of the total outgassing rate and its uncertainty.
We provide in Table A.4 the derived production rates in the jet Qjet only that we obtained when we did not consider any isotropic counterpart. They were obtained by fitting the line intensities along the main jet direction (extractions made in step 4), using the radiative transfer simulations that only consider a jet contribution (Sect. 3.2). Values of Qjet only have smaller uncertainties than Q values, and their relative uncertainties are more representative of the quality of the line detections. They were used to compute relative molecular abundances in the jet (Sect. 10).
Line inversion was possible for NH3 when the line was strong enough (Sect. 4.2). When line inversion could not be performed, so that ⟨ϕJ ⟩ values could not be derived (Step 6), we assumed the value of ⟨ϕJ⟩ determined for H O or CH3OH(3−2–2−1E). For data with low S/N, we observed that considering the isotropic component often added a significant uncertainty on the total outgassing rate because of its wide (4π) extent. This often resulted in an error bar for the retrieved total production rate Q that was larger than the value itself. On the other hand, the uncertainties on Q are conservative because the determinations of QI and QJ are not independent.
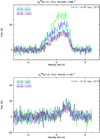 |
Fig. 9 Illustration of step 4 of data analysis. Top panel: jet. Extracted spectra of H |
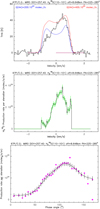 |
Fig. 10 Illustration of step 5 of data analysis for the jet. Top panel: extracted spectra of H |
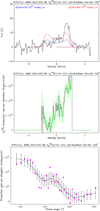 |
Fig. 11 Same as Fig. 10 for the night side. Extracted spectra of H |
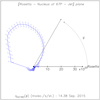 |
Fig. 12 Illustration of step 5 of data analysis. Polar plot representation of the derived angular production rate q(ϕ) for the 7.5–10 km projected radius range. The maximum of production (q = 3.5 × 1024 molec. s−1sr−1) is towards a colatitude angle of ≈110°, slightly away from the direction of Rosetta. |
F1 Hyperfine components of the H O and NH3 lines observed by MIRO.
4.2 Deconvolution of the ammonia line profile
The ammonia line consists of three hyperfine components, with statistical weights of 1/3, 5/9, and 1/9, which partly overlap (Table 3). In order to retrieve the jet profile along the ϕ angle, the line profile needs to be deconvolved to infer the Doppler profile of NH3. This was possible for data acquired from June to October 2015, when the ammonia line was strong enough. We adopted a simplified approach because the F(0 − 1) component at −0.953 km s−1 and the F(1 − 1) component at +0.650 km s−1 partly do not overlap the main F(2 − 1) hyperfine component. In the simple case of an optically thin line and a Doppler line width smaller than 1.6 km s−1, the blueshifted (not overlapping)part of F(0 − 1) component and the redshifted part of the F(1 − 1) component can be used to retrieve the Doppler profile of each single component, as illustrated in the upper plot of Fig. 14. In practice, we retrieved the profile of the strongest (most opaque) F(2 − 1) hyperfine component by subtracting the estimated overlapping parts of the weaker components. For broad lines, we used an iterative process to correctly retrieve the contribution of each component to the full line, resulting in a retrieved F(2 − 1) line profile with a noise increased by a factor 1.3–4.3 depending on the channels. To cope with opacity effects, which only affect the main component, we introduced correcting factors in the iterative process. Figure 14 illustrates the deconvolution for optically thin and optically thick synthetic spectra. The major caveat of the method is that a dip appears in the central part of the line for optically thick cases. However, the line width and position are correctly retrieved and the line area is preserved, therefore we expect that the retrieved outgassing profile is not significantly affected.
The results of this analysis are presented in Table A.3, which provides the retrieved jet characteristics and production rates for each map and molecule. In addition, the column densities measured along the jet axis are provided in Appendix D for each day. The column densities are more directly comparable to measurements obtained by other remote instruments such as VIRTIS and Alice.
5 Uncertainties and biases on the retrieved outgassing rates
5.1 Smearing of the maps through long integrations
Maps were acquired in typically 3–4 h (Table A.1), during which the nucleus rotated by 90°–120°. This affects our determination of the gas jet properties. If it rotated by this amount, the maps and line profiles do not reflect the effective angular extent of the jet. However, in practice, our analysis is not significantly affected by this effect: (i) the actual time spent to scan the jet itself is shorter than for the total map; (ii) if the jet is rotating in the plane of the sky, it should appear broader when we scan in the direction of motion and narrower in the opposite direction: this should average out or show some systematic effects; (iii) for the jet transverse profile width deduced from line profile, we used a subsample of integrations that were acquired over an even shorter timescale; (iv) as shown in Table A.3, when several consecutive maps of H O were reduced separately, the motion of the jet between two maps is generally small (less than 20°), which means that the smearing is not significant. Finally, we find that the outgassing pattern is not instantaneously connected to the surface topography of the nucleus, but rather to the illumination, and it depends more on the Sun and pole directions, which do not change much during the mapping.
5.2 Effect of the uncertainty on the expansion velocity
The terminal expansion velocity vexp is readily determined from the absorption peak in lines against the nucleus: this provides us with the value on the line of sight. For this measurement, the uncertainty is generally below 0.01 km s−1 and has negligible effect on final results. There is evidence that the expansion velocity varies both radially (vexp(r)) and laterally, however. For the radial variation, we could have used a two-parameter law (e.g. as in Biver et al. 2011), but this would only be necessary for the H O optically thick line for the contribution at lower velocity close to the nucleus, which is not used to determine the water production. Nevertheless, close to perihelion, the “inversion” of the line profiles does require lower velocities close to the nucleus. In this case, we used different fixed values of vexp(ρ) for projected distances below 5–10 km (e.g. 0.82 km s−1 below 8 km, then 0.85 and 0.87 km s−1 beyond 10 km to invert the line profiles obtained on 14 September 2015). For the lateral variation of vexp, we also clearly see that the expansion velocity is higher in the jet closer to subsolar point than elsewhere. For instance, on 14–26 September 2015, nadir pointing at phase angles (line-of-sight–jet angles) of 103° (117°), 90° (110°), and 54° (50°) yield values of 0.82, 0.84, and 0.90 km s−1 for vexp on the line of sight. This means that the expansion velocity close to the axis of the jet is higher than is often measured on the line of sight (away from the jet). We tried to constrain vexp from the line profile itself while inverting the line. The derived value (Table A.2, Col. 3) is likely lower than the true value in the center of the jet, but more representative of the average velocity vexp needed for a correct line profile inversion. Nevertheless, we estimated the effect of a 10% error on vexp: an underestimation by 10% results in an overestimation of the jet width θϕ, and in an underestimation of the peak outgassing rates per solid angle qJ,ϕ and qJ, az. In the end, the retrieved total production in the jet would be underestimated by 6%. Because it is unlikely that we underestimated vexp by more than 10%, the underestimation of Q is lower than ~ 6%.
5.3 Effect of the uncertainty on the gas temperature
We used a temperature law consistent with the derived methanol rotational temperatures and the peak temperatures of the saturated H O line. However, the agreement is not always perfect, possibly because their rotational temperatures differ (e.g. due to collisional excitation effects). The CH3OH rotational temperature tends to show deviations from the assumed 1/r profile, with slightly higher values locally in the r = 7–10 km range, for example, as shown in Fig. 6. Therefore, we explored the effect of a 20% increase in temperature along the jet. The test for the data of 11.6 November 2015 shows that the effect is negligible on the derived water production rate (–1.5%) andsmall for methanol when the three lines (+13%) are considered. For ammonia, increasing the gas temperature by 20% increases the production rate by +19%. Another test, using data of 8.7 September 2015, where we instead used temperatures higher by ~8%, did not change any of the final production rates by more than 2%. CO is still less affected. We tested the effect for the observation on 30 August (nadir data) – 1 September 2015 (map) on retrieving the CO production rate of a temperature profile that decreases from the surface temperature to a terminal value between 10 and 200 K (extreme cases, 43 K being the adopted value from Table A.2). For the mapping data, the adopted temperature profile yields the lowest CO production rate, but a factor two in the terminal temperature will not increase the CO production by more than 10%. Only the extreme case of a temperature profile would yield a 20–30% increase in CO production. As a conclusion, the derived water and CO production rates do not depend much on the gas temperature, while those of methanol and ammonia could be slightly underestimated if we underestimate the gas temperature. For methanol, the observed behavior is strongly dependent on the lower energy level CH3OH(3−2–2−1E) line (Table 1), which is much better detected than the two other transitions and has a greater weight in the computed average production rate. On average, T + 20% therefore implies same QH_2O and QCO, QCH_3OH + 10% and QNH_3 + 20%.
5.4 Opacity effects
To invert the line profiles, opacity is taken into account to first order assuming that the line intensity is proportional to Q1+x. The coefficient x was determined using the radiative transfer model by computing the line area for two different production rates Q that encompass the observed value.
We had to account for high opacity effects when we analyzed the H O line (when H
 O is too faint), or for the H
 O line itself, or even sometimes around perihelion for the NH3 line. During the line inversion process, we did not consider the channels where optical thickness is so strong that our simplified model fails to reproduce their intensity. This particularly concerned channels at negative velocities, that is, sampling the gas along the line of sight near the spacecraft. For high optical depths (τ > 1.0), the intensity starts to depend much more on the local temperature T(r, θ) and velocity gradient than on the column density, and a full 2D accurate modeling of T(r, θ), vexp(r, θ) and n(r, θ) would be necessary. We note that by averaging the molecular lines in time and spatially, local variations in line opacities that are due to fine, denser structures in the jet, for instance, were possibly erased.
H O, H
O, H O, and H
 O have a very different optical thickness. To study the H2O outgassing properties, we mostly used the H
 O line, which is most of the time detected and not saturated (16 O/18O ~ 500). Because of its complex hyperfine structure (Table 3), the H
 O line cannot be easily used to invert the line profile. On the other hand, this line is on average ten times less optically thick for an 18O/17O isotopic ratio of 5.4. As we discussed above, the outgassing rates of H
 O were retrieved using information on the transverse geometry of the outgassing obtained from either H
 O or other molecules. The constancy of the derived Q(H
 O)/Q(H
 O) ratio (Fig. 19, Sect. 9) indicates that opacity effects were well estimated for H
 O.
O.
5.5 16O/18O isotopic ratio and water ortho-to-para ratio
For more than 95% of the maps, we used the observation of the ortho line JKa, Kc = 110–101 of H O to retrieve the total outgassing rate of water. We assumed an H
 O/H
O/H O ratio of 500. This isotopic ratio is close to the Earth value (498.7), and is compatible with values observed in other comets (Biver et al. 2007, 2016; Bockelée-Morvan et al. 2012, 2015b). The Rosetta Orbiter Spectrometer for Ion and Neutral Analysis (ROSINA) mass spectrometer instrument and the cometary secondary ion mass analyser (COSIMA) with its time of flight mass spectrometer (TOF-SIMS) on board Rosetta have measured the 16O/18O in different materials: 555 ± 62 in H2O with ROSINA double-focusing magnetic mass spectrometer (DFMS) in September 2014 (Altwegg et al. 2015), 445 ± 35 with ROSINA DFMS in H2O and OH by Schroeder et al. (2019) and 500 ± 30 in dust grains by Paquette et al. (2018). No observation suggests that this ratio departs by significantly more than 11% from the telluric value, which means that in the worst case, we might underestimate or overestimate the water outgassing rate by 11% for this reason.
We also assumed an ortho-to-para ratio (OPR) of 3. The OPR can be derived from infrared H2O spectra where several ro-vibrational lines of ortho and para species are observed simultaneously. Values measured in cometary H O range from ~2.5 to ~3.0 (Bockelée-Morvan et al. 2004; Mumma & Charnley 2011). The OPR of H
 O, which has not been yet measured, is presumably similar to that of H
 O. If the OPR is lower, for example, 2.5 instead of 3, then we underestimate the total water production rate by a factor (3.5/2.5)/(4/3) = 1.05, that is, 5%. With these uncertainties in the 16O/18O ratio and OPR, in the worst case, we may have underestimated the total water outgassing rate by 15% in the worst case or overestimated it by 11% when we used the 16O/18O measurement of Schroeder et al. (2019).
6 Comments on specific days
6.1 13 October 2014 to 18 January 2015
No coma maps were made between 29 July 2014 and mid-February 2015. Only partial maps of the nucleus with part of the inner coma were made, such as the map presented in Biver et al. (2015). In order to still retrieve some information on the global outgassing, we used some observations that provided good enough sampling of the coma around the nucleus to constrainboth the azimuthal and transverse extent of the outgassing, in most cases at one or two projected distances from the nucleus. However, the azimuthal sampling can be uneven and/or have varying S/Ns, especially for 12 and 13 October 2014. As a consequence, the determined outgassing pattern can be less precise for these dates.
6.2 27 August and 1 September 2015
On these dates, during the perihelion period, the south pole and Sun directions were closest with respect to the direction of Rosetta: a Rosetta-comet-south pole angle (colatitude angle) of ≈46°–41° and a Rosetta-comet-Sun angle (phase angle) of 77°–71°. The bulk of the outgassing was also closer to the spacecraft direction (colatitude ≈49°) than for the other maps. The observed lines are indeed strongly blueshifted (Δ v ≈−0.2 km s−1), and the parameters of the jet were adjusted to reproduce the observed blueshifts as well as possible. In this geometry, the line intensity is much more sensitive to the modeling of the jet pattern, with an opacity of the H O line close to 1.0 on average, and 3.0 in the most strongly blueshifted part of the line, which has strong self-absorption.
The single nadir pointing observation in these maps yields a high production rate per solid angle on the line of sight of  –1.7 × 1027molec. s−1 sr−1, based on the H
 O and H
 O lines, which is comparable to the highest value reported by Marshall et al. (2017) and is consistent with the value derived from the inverting the mapping data.
6.3 8 September 2015
The two maps were obtained in a relatively fast scanning scheme (5.4 km per spectrum). As a consequence, the projected width of the jet on the plane of the sky is likely slightly overestimated, and indeed the derived width is larger than for other dates. On the other hand, the peak intensity might be underestimated, which compensates for the overestimated width in the final computation of the production rate. The jet is also found to be mostly pointing away from the spacecraft (colatitude ≈ 130°), which also adds some uncertainty in the azimuthal retrieval of the jet width. In addition to the paucity of nadir pointing data caused by fast scanning and large comet-spacecraft distances, the low outgassing rate toward the spacecraft resulted in the absence of usable absorption lines for this period.
6.4 14 September 2015
When we average the three maps obtained on this date, all lines except for CO are clearly detected and the S/N warrants retrieval of outgassing pattern information. Averaging CO data on large angular sectors and distance bins yields some marginal detection that also enables line inversion. These maps suggest that the bulk of CO outgassing is in the same direction as other species. Example of spectra and inversion steps are shown in Figs. 8–13. Interestingly, the width of the jet derived for methanol is line dependent (Table A.3) and is lower when the energy of the upper level of the line transition is higher (Table 1). This suggests that the higher energy levels are more populated in the center of the jet, indicating that the temperature decreases laterally from the jet axis. This lateral variation is also visible in the map of the gas temperature derived from the saturated H O line (Fig. C.1).
 |
Fig. 13 Step 6: combining results of step 5 for each range of projected radius. Derived angular production rate
q(ϕ) for the H |
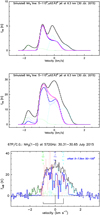 |
Fig. 14 Top panel: simulated optically thin (QNH_3 = 2.25 × 1024 molec. s−1) NH3 line (in black); the Doppler profile of the F(2 − 1) component is shown in pink. The dotted lines show the estimated F(0 − 1) (green), F(1 − 1) (light blue), and F(2 − 1) (red) profiles by the deconvolution routine. The adopted retrieved profile for the F(2 − 1) component alone from the deconvolution process is shown in bold dark blue. This is the average of the subtraction result of the estimated F(0 − 1) and F(1 − 1) profile from the full line and estimated F(2 − 1) (red) profile.Middle panel: same as above, but for QNH_3 = 22.5 × 1024 molec. s−1 with strong optical effects, which results in slight differences between the retrieved bold dark blue profile and the simulated pink profile. This corresponds to the highest opacity case encountered for this line. Bottom panel: NH3 line observed on 30.31–30.65 July 2015 (black), and the deconvolved Doppler profiles of the hyperfine components (same color coding as above plots). The position and relative intensities of the three hyperfine components are indicated below the line, and their identification is indicated above. |
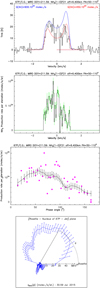 |
Fig. 15 Illustration of step 5 of the data analysis for a deconvolved NH3 line profile. See the caption of Fig. 10 for the three upper plots, and the caption of Fig. 12 for the bottom plot. |
6.5 2 October 2015
The four maps of 2 October 2015 were obtained at one of the largest spacecraft distances (≈ 1200 km) and smallest angles between the line of sight and jet axis (33°–45°). As a consequence, the H O line observed with line-of-sight sampling near-nucleus coma regions has a significant opacity (τ up to 2), and change of a a few degrees in the direction of the jet can significantly change the line intensity and azimuthal profile. While the transverse (in the Rosetta-comet-jet plane) profile of the outgassing pattern is relatively well constrained, especially for the methanol lines, which are optically thin (τ < 0.1), the distribution in the plane of the sky is not very well constrained and the derivation of θaz has a large uncertainty or does not converge. The line inversion suggests that the isotropic component (q in the anti-jet direction) is very small (≈1∕40 of peak q). Therefore, we assumed that its contribution is negligible when we retrieved the azimuthal width of the jet. In order to model the jet (and the opacity effects) as accurately as possible, special care was given to reproducing the observed Doppler shift of the lines (Δ v = −0.19 to − 0.37 km s−1 depending on the lines and maps).
6.6 22 November 2015
On 22 November 2015, the south pole of the comet was close to the line of sight (colatitude angle less than 30°). All lines appeared blueshifted (Δv = −0.1 to − 0.4 km s−1), and the column densities on the line of sight are high, consistent with a bulk of outgassing close to the line of sight for most molecules. For this geometry it is difficult to derive the projected width of the jet on the plane of the sky (and make the deprojection) and extract the residual signal outside the jet. Hence, uncertainties on the effective solid angle of the jet and on the ratio of the isotropic (night) to the jet components of the outgassing are larger. However, the calculation of the total outgassing rate (sum of isotropic + jet outgassing) should be less strongly affected.
6.7 3 December 2015
On this day,the bulk of the outgassing clearly moved away from Rosetta (all lines were redshifted). The colatitude of the CH3OH jet (140°) was larger than for H2O and NH3 jets (110°–120°). The derived jet widths (both in azimuth and perpendicularly) were larger than usual, so that part of the outgassing (especially for methanol) also came from the night side. Because of the large jet colatitude angles, the retrieved deprojected azimuthal width of the jet has a high uncertainty.
7 Constraints on abundance variation with latitude obtained from nadir pointings
7.1 Analysis of selected nadir observations
In order to provide further constraints on the outgassing pattern, we analyzed nadir pointings by averaging the data obtained over at least one full rotation of the nucleus. We selected observations with similar sub-spacecraft latitudes (or pole colatitude angles). The mean expansion velocity was derived from the line shapes, and the temperature profile was obtained from the (most often saturated) H O line profile, as explained in Sect. 3.4.3. We derived the column density and production rate per unit solid angle q for each line. We weight-averaged the values obtained for the different methanol lines. For water, we used the weighted average of 500 × q (H
 O) and q (H
 O), and 2700 × q (H
 O) when the S/N was high enough. For H
 O and H
 O, q was estimated from the line area integrated over channels at negative velocities and the full line area by averaging the two results according to their error bars. Imperfect modeling (acceleration close to the nucleus is neglected, but this is not the main source of discrepancy when testing with a radially variable expansion velocity model) and the complex structure of the outgassing pattern mean that the difference between the q derived from the two parts of the line can be very high when the opacity is important (τ > 100). Highly opaque lines were therefore given a low weight when we computed q from these lines. When production rates became very low and H
 O was weakly detected, qH_2O was mostly based on the main H
 O line.
7.2 Results
The computed nadir water production rates (per solid angle) and relative abundances of CH3OH, NH3, and CO arelisted in Table A.5. We provide the time interval (in most cases by averaging variations over nucleus rotation), heliocentric distance, latitude of the subsolar point (0° at equinoxes) and average colatitude of the north pole ϕN, the angle between the Rosetta-comet line, and the direction of north pole (sub-spacecraft latitude = 90 − ϕN). Figure 16 shows the abundances versus sub-spacecraft latitude for selected time intervals.
Especially for CO, for which mapping data do not give precise values for the jet width and direction, we used these measurements to obtain rough constraints on the outgassing patterns. The objective was to obtain approximate average characteristics: jet width and latitudeover four periods of a few months, as listed in Table 4. The jet width and latitude of H O were derived from those of H
 O from the mapping data (Figs. 20 and 21). For each of the selected periods (Table 4) we multiplied the derived abundances versus latitude (Fig. 16) by the H
 O Gaussian jet profile (meridian cut) and fit a Gaussian to the result. This gave an estimate of the width and latitude of the Gaussian jet of the considered molecule. The results are provided in Table 4: values in parentheses are weakly constrained, especially when the jet is close to the pole.
In their analysis of MIRO nadir observations, Marshall et al. (2017) derived total production rates assuming uniform outgassing in a 4π solid angle. They multiplied the derived nadir production rates per solid angle qnadir by 4π. These values varied strongly with the location of the line of sight relative to the direction of outgassing. To provide more realistic values, we considered the outgassing pattern (jet width and orientation) derived previously for each molecule, and the direction of the line of sight.
When we define the ratio γ = qI∕qJ of the angular production rate in the isotropic component to the peak outgassing rate per solid angle in the jet, the total outgassing rate is
 (10)
(10)
θoff is the angle between the line of sight and the jet. The jet is assumed to be at the local noon meridian (phase = 0°) and originating from the determined latitude (Table 4). σJ is derived from the jet width,
 (12)
(12)
γ can be evaluated from the results in Table A.3, but is not very well constrained. We adjusted γ in order to minimize the fluctuations of total production rates obtained with different geometries. Values are in the range 0–20%, more often 5–10%, with γ = 0.07 yielding the most satisfactory results.
The resulting ratio of QI∕Qtotal is then γ∕(γ + Ωjet∕4π). However, the value of QI that can be deduced from this equation does not necessarily have a physical meaning, and does not imply that there is water production from the night side. This isotropic contribution is rather a mathematical way to fully describe the gas distribution around the nucleus and derive correct production rates. When the S/N allows (e.g. in Biver et al. 2015), we always detect gas on the night side, but this may be gas released from the illuminated regions that is diffused behind. The heliocentric evolution of the total production rates derived from nadir observations is shown in Fig. 17.
Molecular jet characteristics retrieved from nadir pointing measurements.
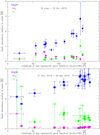 |
Fig. 16 Top panel: abundances of CH3OH, CO, and NH3 relative to water as a function of the sub-spacecraft cometocentric latitude during the nadir pointing. The selected time interval (19 June–10 October 2015) corresponds to a four-month period around perihelion. Bottom panel: same as above for the time interval of 21 November 2015–24 February 2016, four months after perihelion. |
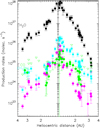 |
Fig. 17 Total production rates of water (black, assumed to be |
8 Distributed water sources
The presence of a distributed water source has been proposed to explain the discrepancy of a factor of 4 between water production rates derived near perihelion from VIRTIS near-nucleus data and from ROSINA in situ data obtained at cometocentric distances >200 km (Fougere et al. 2016). A discrepancy of a factor of 2.5 between the maximum water production rates is also measured by MIRO (~0.8 × 1028 molec.s−1) and ROSINA (2.04 × 1028 molec.s−1; Läuter et al. 2019). The MIRO water maps, as well as the comparison of water production rates derived with different field of views, provide constraints on the existence of distributed water sources, such as the sublimation from icy grains, or the decomposition of water dimers and clusters in cometary atmospheres (Crifo & Slanina 1991).
When the maps are sufficiently extended, we can investigate the evolution of the total water production rate as a function of the projected distance (ρ) from the nucleus. If water were partly released by some distributed source, we would expect the production rate to increase with increasing ρ.
We have computed production rates for a set of circular annuli (n) covering each ρ = 2.5n to 2.5(n + 1) km using the same method as for the global map (i.e. deriving angular production rates and the jet FWHM in each annulus). This method presents some biases that are due to (i) the scanning scheme, which introduces significant smearing for the innermost annuli, and (ii) variations of the temperature and gas velocity with distance to the nucleus, which were taken into account as well as possible, however.
Figure 18 shows two of the main significant results. Within error bars, no variation is observed for the derived production rates over the first 20 km from the nucleus: the variation is + 6 ± 5% per 10 km on 20 August and + 7 ± 9% per 10 km on 8 September 2015. A simulation gives an increase of +17% per 10 km (in projected distance) in apparent production for a real increase in production of +10% per 10 km (in radial distance). Based on this, we can conclude that the contribution of icy grains to the total water content at 20 km from the nucleus is less than 15% (3σ upper limit).
Odin, a submillimeter satellite in Earth orbit (Nordh et al. 2003; Frisk et al. 2003), also observed the H O line at 556.936 GHz in comet 67P on 9.47–12.10 November 2015 at a geocentric distance of 1.79 AU. Owing to the 2.1′ Odin beam width, the field of view was 165 000 km. The line was not detected, with a 3σ upper limit to the line area of 0.057 K km s−1. Adopting excitation parameters similar to those used for analyzing the MIRO observations, we derive an upper limit for the water production rate QH_2O < 3.3 × 1027molec. s−1 (Snodgrass et al. 2016). The total water production rate estimated from MIRO measurements at the same time (11.5 November) is 2.2 ± 0.1 × 1027molec. s−1. Because the average cometocentric distance sampled by MIRO is on the order of 15 km, the comparison between the two measurements indicates that if there was significant water production from a distributed source beyond 20 km, then its production rate did not exceed 50% of the value measured by MIRO. Altogether, our investigation of the contribution of sublimating icy grains to the total water content at 20 km from the nucleus and our comparison with the Odin data suggests that the discrepancy of a factor 2.5 between the production rates derived from MIRO and ROSINA measurements cannot be explained by sublimating icy grains.
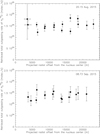 |
Fig. 18 Top panel: retrieved total water production rate as a function of the projected distance
ρ
from the center of the nucleus, based on selected rings in the two maps of H |
 |
Fig. 19 Production rates ratio of H |
9 H O/H
O/H O ratio
H O is detected in MIRO spectra (e.g. Fig. C.1). This is the first spectroscopic detection of cometary H
 O. Deriving the oxygen isotopic ratios from the MIRO data is a complex task. The opacities of the H
 O, H
O, H O and H
 O lines are very different and the dynamical range of the MIRO spectra is limited, therefore we cannot compare two lines in a linear regime. A modeling of the line profiles using very accurate velocity, temperature, and density profiles is necessary to derive precise isotopic ratios. In addition, the H
 O line occupies most of the spectral window, which makes an accurate determination of the baseline difficult.
Here we computed the H O/H
O/H O ratio by forming a ratio of the production rates (or production rates per solid angle for nadir observations) derived for H
 O and H
 O (Fig. 19). There is significant scatter in the derived H
 O/H
O/H O in ratios, but no significant trend with time (hence with production rate or opacity) is observed. Some higher values are measured in nadir pointing alone in February 2016, but the detection of H
 O is marginal forthese observations, and retrievals are very sensitive to the baseline removal. The average value using all measurements is H
 O/H
O/H O = 5.45 ± 1.3. A value of 5.6 ± 0.8 is derived when we only consider the jet production rates, which have lower uncertainties (squares in Fig. 19, with values listed in Table A.4). This is compatible with the telluric value (Vienna Standard Mean Ocean Water VSMOW = 5.28) and the ROSINA measurement performed at the beginning of the mission (4.9 ± 1.2 from Altwegg et al. 2015).
10 Long-term evolution of the outgassing
The analysis of the maps presented here provides us with information on the long-term evolution of the outgassing pattern and production rate of the various molecules observed with MIRO. Because the maps were acquired over a few hours, rotational variations are to some extent averaged out. Comet 67P exhibited numerous dusty outbursts, especially during the perihelion period (Vincent et al. 2016). However, there is little evidence for significant gas enhancement during outbursts in MIRO data (Marshall et al. 2017; Grün et al. 2016).
10.1 Outgassing pattern
Figures 20 and 21 show the time evolution of the source region and width of the jet for the different molecules. The seasonal evolution is clearly visible in these two plots: before the first equinox (10 May 2015, 95 days before perihelion), the outgassing originates from the northern hemisphere (50° N) and is concentrated in a narrow jet (FWHM ~ 70°–90°, Fig. 21). The neck region of 67P is the main source of outgassing during this period, as also observed by other Rosetta instruments (e.g. Migliorini et al. 2016, for VIRTIS). After the first equinox, the activity of 67P moved rapidly to the southern hemisphere. The outgassing also spread over a wider part of the nucleus. The width of the jet reached its maximum at equinox, on the order of 140°; in some maps, two jet components were required to best fit the spatial distribution (e.g. for methanol on 15 May and 24 June 2015, Table A.3).
During the perihelion period, when the gaseous activity was high, the outgassing originated essentially from the southernmost regions, even farther south than the subsolar point, and the jet width was about 110°. After the second equinox (21 March 2016, 220 days after perihelion), the water outgassing returned to the northern hemisphere (Fig. 20), while methanol and ammonia continued to be mainly released from southern regions. In the last MIRO maps, obtained later than 250 days after perihelion, all species originated from the northern hemisphere. Compared with water and methanol jets, the latitude of the ammonia jet is in general closer to the subsolar latitude. On the other hand, methanol always comes from farther south than H2O and NH3. Compared with ROSINA results, the seasonal evolution of the outgassing of CH3OH follows that of CO2 (Läuter et al. 2019). In Fig. 20, using a degraded version of the nucleus shape model SPG SHAP7 (Preusker et al. 2017) with 125 000 facets, we have also plotted the expected average latitude of the surfaces that receive at least 95% of the maximum solar flux over a 3 days period. As can be anticipated this gives a closer match than the sub-solar latitude to the evolution of the latitude of peak of outgassing, possibly with some delay post-perihelion caused by thermal inertia.
 |
Fig. 20 Evolution of the mean latitude of the bulk of outgassing (jet) water, methanol, and ammonia from July 2014 to September 2016. The red stars show the latitude of the subsolar point, which crosses the equator at the comet equinoxes, 95 days before perihelion and 220 days after. The green dotted line corresponds to the average latitude of the facets that receive the maximum solar flux. |
 |
Fig. 21 Evolution of the mean angular extent of the bulk of outgassing (jet FWHM) water, methanol, and ammonia from July 2014 toSeptember 2016. Representative values of the extent of the solid angle of the jet (non-linear scale) are given on the right. |
10.2 Evolution of outgassing and relative abundances in the coma
Figure 22 shows the production rates as a function of heliocentric distance and time, derived from the maps. Results from nadir measurements are presented in Fig. 17. CO production rates derived from nadir measurements have a better S/N ratio, but are marginally lower than those deduced from mapping data. The test on the 30 August 2015 shows that the nadir-derived CO production rate is more sensitive to the temperature profile than the rate derived from the maps: if we increased the terminal CO temperature by a factor 2 (compared to the adopted profile for other molecules), the retrieved CO production rate would increase by the same factor and the CO abundances derived from maps and nadir observations would be reconciled. On the other hand, nadir-derived production rates are about 30% higher for the other molecules. The nadir measurements are more uncertain because they rely on our Gaussian jet modeling, which is too simplistic to describe the density distribution along specific line of sights.
We derived power-law fits ( ) for the heliocentric evolution of the production rates, which are shown in Fig. 22. Three periods were considered: pre-perihelion, post-perihelion below 1.52 AU, and post-perihelion beyond 1.52 AU. The fit parameters are provided in Table 5. The heliocentric variation in production rates is much steeper (
 to
to  ) than observed forlong-period comets such as C/1995 O1 (Hale-Bopp; Biver et al. 2002). This steep variation is due to the strong activity of the southern hemisphere during summer and points to strong seasonal effects. The heliocentric evolution of the outgassing rates of H2O, CO2, CO, and other species has been studied by Hansen et al. (2016), Gasc et al. (2017), Läuter et al. (2019), using ROSINA data. MIRO results are in line with the results of Läuter et al. (2019), who also found steep variations for CO and CO2 (to which CH3OH seems to be linked because they have similar outgassing patterns), but with a lower total abundance of CO (≈ 0.6% versus 2% post-perihelion before equinox) for MIRO. The maximum outgassing rates are measured at the end of August and beginning ofSeptember 2015, that is, about three weeks after perihelion. This is consistent with ROSINA measurements (Hansen et al. 2016).
Figure 23 shows the evolution of the production rate ratios of CH3OH, NH3, and CO relative to the water production rate (hereafter called abundances because they refer to abundances in the coma). Mapping and nadir measurements are both plotted and show consistent results. The abundances display clear time variations. In particular, after perihelion, the methanol and CO abundances increase with increasing heliocentric distance, while ammonia becomes less abundant in the coma. As discussed in Sect. 10.1, after perihelion, CH3OH mainly outgassed from the southernmost regions, while water production progressively moved from southern to northern regions. The increase in methanol abundance in the coma after perihelion can then be explained by the sustained activity of the southern hemisphere, whereas the H2O activity decreased more rapidly. The similar behavior that is observed for CO suggests that the southern hemisphere was also overproductive in carbon monoxide. This is consistent with ROSINA measurements, which showed that whereas the source locations of H2O followed the subsolar latitude, CO2 sources were mainly located in southern areas during the whole mission, with CO correlating with CO2 after perihelion (Läuter et al. 2019). Overall, NH3 correlates with H2O in the source region (Fig. 20). This confirms results obtained from ROSINA (Gasc et al. 2017) and suggests that NH3 may be trapped into water ice (e.g. as a trapped species into water amorphous ice, or in the form of a hydrate). The continuous decrease in NH3 abundance is surprising and may suggest that the relative abundance of NH3 embedded in water ice is higher in the southern than in the northern hemisphere. The northern hemisphere is covered by smooth layers of back-fall ice-rich material originating from the southern hemisphere (Keller et al. 2017). This would mean that the chunks that fall back lost some of their volatiles during their flight in the coma, as suggested by Fulle et al. (2019).
Comparing the outgassing patterns and heliocentric trends followed by several species (not including CH3OH), Gasc et al. (2017) did not find any correlation between outgassing properties and the sublimation temperature of the corresponding pure ices. This result is confirmed by the MIRO results. NH3 and CH3OH ices have about the same sublimation temperature (78 and 99 K, respectively; Yamamoto 1985) but behave differently. Gasc et al. (2017) proposed that minor species could be partly embedded in CO2 and partly in H2O ices. Their different power laws with heliocentric distance would therefore be indicative for the ratio between how much is embedded in CO2 and how much is embedded in water.
It is interesting to compare MIRO-derived molecular abundances to those deduced from other instruments. Le Roy et al. (2015) derived from ROSINA data CH3OH/H2O abundance ratios in the range 0.31–0.55% at 3.2 AU inbound, where the lower and higher values correspond to the summer (north) and winter (south) hemispheres, respectively. This is a factor of 2 lower than the mean MIRO value for 2.9–3.46 AU inbound. Their derived NH3/H2O ratio of 0.06–0.15% at 3.2 AU pre-perihelion is also somewhat lower than our value (0.2%). The discrepancy is still higher post-perihelion. Gasc et al. (2017) reported a NH3/H2O value as lowas 0.04% for 2.0–2.7 AU post-perihelion, whereas the MIRO average value for this period is 0.1%. The CO/H2O ratio derived from ROSINA instruments ranges from ~1 to ~50%, with strong local and temporal variations (Le Roy et al. 2015; Fougere et al. 2016; Hoang et al. 2017; Gasc et al. 2017). A steep decrease from 3.6 to 2.6 AU inbound was observed before it stabilized at a value of about 5% (Fougere et al. 2016). Values measured at heliocentric distances larger than 3.1 AU, inbound and outbound, reach 50%. Läuter et al. (2019) provided the integrated production of water and CO deduced from ROSINA data, and found a bulk CO/H2O abundance of 2.2 ± 0.9%. As shown in Fig. 23, the CO/H2O ratios measured byMIRO (rh < 2.4 AU) are all below 1%. Measurements with the Alice instrument shortly after perihelion lead to CO/H2O ~ 0.5% (Feldman et al. 2018), in agreement with MIRO determinations. A low (<1%) CO/H2O abundance near perihelion is also consistent with the upper limit measured from infrared spectra obtained by VIRTIS (Bockelée-Morvan et al. 2016). In summary, there are significant discrepancies between in situ mass-spectrometer data and remote-sensing spectroscopic data for the abundance ratios.
It is also interesting to compare the abundances measured in comet 67P to those measured in other comets. This was investigated by Le Roy et al. (2015) using the ROSINA data acquired at 3.2 AU inbound. We here used MIRO data acquired near perihelion because most comets were observed near their perihelion. Bockelée-Morvan & Biver (2017) presented histograms of abundances based on radio measurements of 46 comets. 67P appears to have an ordinary methanol abundance, and does not belong to the methanol-rich group of comets that exhibit abundances relative to water in the range 3–6%. The NH3 abundance of 67P, typically 0.4% at perihelion, is in the range of values observed for other comets: 0.2–0.7% from radio measurements (Bockelée-Morvan & Biver 2017) and 0.1–1.7% from infrared data (Dello Russo et al. 2016). Comets observed near 1 AU from the Sun display CO/H2O production rate ratios in the range 0.2–23% (Bockelée-Morvan & Biver 2017). Comet 67P value is at the low end of this range, as are other Jupiter-family comets. This possibly results from a stratification in the ice composition of the subsurface layers of 67P caused by its multiple passages close to the Sun, with the most volatile species only residing in very deep layers.
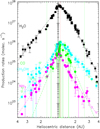 |
Fig. 22 Heliocentric evolution of the total production rates of water (black, assumed to be 500 × QH218O), methanol (cyan), carbon monoxide (green), and ammonia (magenta) from July 2014 to September 2016, based on mapping data. The horizontal scale is the heliocentric distance (pre-perihelion on the left, and post-perihelion on the right). Empty down-pointing triangles correspond to 3σ upper limits. Dotted lines are power-law fits to the heliocentric evolution (see Table 5). |
Power-law fit β to the production rates ( ) based on mapping data.
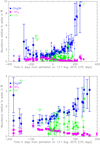 |
Fig. 23 Evolution of the abundances relative to water of methanol, ammonia, and CO in the coma from July 2014 to September 2016. The larger symbols are based on the global outgassing rates derived from mapping data. Additional more local measurements from nadir or single lines of sight are shown by smaller symbols in the upper panel. Empty down-pointing triangles correspond to 3σ upper limits.Bottom panel: zoom over ± 200 days aroundperihelion. |
10.3 Bulk abundances and mass losses
We have computed the cumulative mass loss of volatile species during the 2015 apparition of 67P. The results for water and the other molecules observed by MIRO, obtained using linear interpolation between each point, are shown in Figs. 24 and 25, respectively. The total mass losses are listed in Table 6. Because CO data are lacking beyond 140 days post-perihelion, we assumed that the CO production followed the trend of CH3OH in that period. Results obtained using the derived power laws for the heliocentric dependence of the production rates provide similar results (Table 6). Overall, 95% of the volatile mass was lost between the equinoxes, when the southern hemisphere was exposed to the Sun. Ratioing the mass-loss rates to that of water, the relative mass-loss rates are 1.5%, 0.34%, and 0.6% for CH3OH, NH3, and CO, respectively, with a large uncertainty for CO (Table 6). For CO, we adopt a mean abundance of 0.6 ± 0.2% as a compromise between mapping and nadir measurements.
The derived total water loss derived from the mapping data is 2.4 ± 0.1 × 10⁹ kg (Table 6), which is a factor of 2–3 lower than the values derived from ROSINA data: 4.8 ± 1.5 × 10⁹ kg (Läuter et al. 2019)and 6.9 × 10⁹ kg (Hansen et al. 2016). The values derived from the MIRO nadir data are 17–35% higher than those obtained from mapping data and consistent with the mapping-derived value for the power-law fits. The nadir-integrated mass loss is probably slightly biased upward by the value of 5 September, but the retrieved abundances are fully consistent within the error bars. We note that Marshall et al. (2017) derived a value of 2.4 × 10⁹ kg from his analysis of the nadir MIRO data, which is consistent with ours.
In order to evaluate the total mass loss from ice sublimation, we have to consider other molecules, which were not observed by MIRO but are significant contributors to the gas activity: CO2, O2, sulfur compounds and hydrocarbons. In VIRTIS data (Bockelée-Morvan et al. 2015a, 2016) and ROSINA measurements (Gasc et al. 2017), the CO2 abundance showed a somewhat similar behavior to methanol, but the abundance was about 16 times higher around perihelion. Calmonte et al. (2016) have estimated that the elemental S/O ratio (in numbers) in the gas phase is on the order of 0.015. For O2, we used the average abundance relative to water of 0.02 (in numbers) provided by Läuter et al. (2019). Hydrocarbons and other molecules do not significantly contribute to the mass budget (i.e. by less than a few percent) because of their low abundances (and low molecular masses for the light hydrocarbons). Summing contributions, we find a total ice loss of 4.18 ± 0.18 × 10⁹ kg (the uncertainty related to uncertainties in the OPR and 16O/18O is 11% at most and is not considered here). A 28% higher value of 5.36± 0.35 × 10⁹ kg is derived using nadir data and assuming an OPR of 2.5–3.0 and 16O/18O = 445 ± 35, which is slightly more consistent with ROSINA in situ measurements (Hansen et al. 2016; Läuter et al. 2019). However, as discussed above, we are less confident with this result because the modeling approach is limited.
The net mass loss of the nucleus of comet 67P between September 2014 and June 2016 based on Radio Science Investigations (RSI) of the gravity field (Pätzold et al. 2019) is 10.5± 3.4 × 10⁹ kg, that is, 0.1% of the nucleus mass, and about one meter of surface erosion (Keller et al. 2017). As a consequence, the dust-to-gas ratio, equal to or an upper limit of the dust-to-ice ratio, in the material lost by the comet is 1.5 ± 0.8, including all errors. There is evidence for re-deposition, especially in the northern plains, of dusty material (larger particles; Keller et al. 2017), but the question is how much this represents relative to the mass loss. If the average dust-to-ice ratio of the nucleus significantly differs from what is ejected, it also means that it may no longer be representative to the original value because the nucleus is enriching in refractory or dusty material at each perihelion. For example, if the pristine dust-to-ice ratio is 8:1, and 2:1 in the lost material, this implies that 0.3% of the nucleus mass in pure dust falls back, budgetary speaking, increasing the global to dust-to-ice ratio (by ~ 0.018) at every perihelion passage. This means that it was about 7.5:1 only in 1963 when 67P reached its present orbit. This throws doubt on the original dust-to-ice ratio of the comet, especially if it has been active for several centuries as a Jupiter-family comet, after it left the Kuiper Belt.
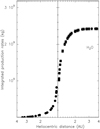 |
Fig. 24 Cumulative water mass-loss rate of comet 67P from July 2014 to September 2016. About 40% more mass is lost post-perihelion than pre-perihelion (~1.4 vs. 1 million tons), but mid-point (50% cumulative loss) is close to the solstice (vertical red dotted line). Ninety-eight percent of the mass is cumulatively lost within ±200 days from perihelion, and 95% between the two equinoxes (vertical blue dotted lines). The total water loss is 2.42 ± 0.04 × 10⁹ kg. |
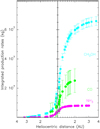 |
Fig. 25 Same as Fig. 24 for methanol, carbon monoxide, and ammonia. The vertical dotted lines indicate the times of the equinoxes (blue) and solstice (red). Only 25% of the mass of methanol and CO has been cumulatively lost at perihelion time. The emission of methanol does not decrease as quickly as for ammonia. The orbit-integrated mass losses at the last points are 66 ± 3, 25 ± 8, and 8.1 ± 0.2 × 10⁶ kg for CH3OH, CO, and NH3, respectively. |
Integrated mass losses and relative abundances.
11 Conclusion
We have presented the analysis of a large data set obtained with the MIRO instrument on board the Rosetta spacecraft. Our study focused on the eight molecular transitions in the submillimeter spectra. From mapping data of the inner atmosphere of comet 67P, complemented by nadir data, we monitored the geometry of the outgassing and the production rates of H2O, CH3OH, NH3, and CO for a period covering June 2014 to June2016 (rh = 1.24–3.65 AU). The 3D spatial distribution of these molecules was deduced by fitting the Doppler velocity profiles and their variation across the coma. We used a simplified modeling that only included measurable parameters. The main results of this study are listed below.
-
The latitudes of the source regions show that water and ammonia outgassing approximately followed the subsolar point, while methanol was released from the southernmost regions during an extended time period after perihelion. At the two solstices, the emission of all molecules originates farther poleward of the subsolar latitude.
-
The spatial distribution of the molecules around the nucleus is anisotropic, and more than 90% of the molecules are concentrated in a Gaussian-like jet, with a FWHM ranging from 70° –140°. The jet width evolves with season, is broadest around the pre-perihelion equinox and narrower before, when the main outgassing source was near the north pole, that is, the neck areas.
-
The production rates displayed steep heliocentric variations (
 to
to  ), which we explained by the strong activity of the southern hemisphere when it became illuminated. These strong seasonal effects are probably related to significant erosion in the southern hemisphere, along with accumulation of volatile-poor dust particles that fall back in the northern hemisphere.
 -
The mean abundances in the coma exhibited significant changes near perihelion and during the following months. Whereas the production rate ratio of ammonia to water slightly decreased as the comet receded from the Sun, the CO/H2O and CH3OH/H2O production rate ratios increased. In the range 1.24–3.2 AU post-perihelion, the abundance of methanol increased from 2 to 20%.
-
The CO and CH3OH sources are mainly located in southern areas and seem to correlate with the source regions of CO2. The sustained production of these molecules from the southernmost regions after perihelion can be explained by sublimation fronts closer to the surface. Indeed, southern regions were strongly eroded. We found that 95% of the mass lost by the nucleus was released between the equinoxes.
-
There is no correlation between the behavior of NH3, CH3OH, and CO and the sublimation temperature of the pure ices, in line with the conclusions of Gasc et al. (2017).
-
The total loss rates over two years were measured individually for each molecules, giving CH3OH/H2O = 1.5 ± 0.1%, NH3/H2O = 0.34 ± 0.01%, and CO/H2O = 0.6 ± 0.2%, in numbers.
-
The total ice loss for the 2015 perihelion passage of comet 67P, including molecules not observed with MIRO, is estimated to be 4.2 ± 0.2 × 10⁹ kg, up to 5.4 ± 0.4 × 10⁹ kg in the maximum case when considering less confident nadir data analyses. From the total mass loss of the comet measured by the RSI experiment (Pätzold et al. 2019), we derive a dust/ice mass-loss of 1.5 ± 0.8.
-
The abundances of CH3OH and NH3 measured around perihelion are in the mean of values measured for other comets. However, the CO/H2O abundance is in the low end of measured values.
-
The H
 O/H
O/H O is not tightly constrained. The derived value of 5.5 ± 0.8 is consistent with VSMOW.
 -
There is no significant evidence for a distributed source of water, such as sublimating icy grains, within 20 km from nucleus center. By comparing MIRO measurements to remote observations performed with the Odin telescope, we concludethat the discrepancy of a factor of 2.5 between the water production rates of MIRO and ROSINA cannot be explained by this process. The contribution of a distributed source of water is at most 50% of the production rate measured by MIRO.
One central question in cometary science is the degree to which molecular abundances in cometary atmospheres are representative of the internal composition of the nucleus. The MIRO results on the activity of 67P, combined with those obtained with other Rosetta instruments and thermophysical models, should help answering this question.
Acknowledgements
The authors acknowledge support from their institutions and funding sources. A part of the research was carried out at the Jet Propulsion Laboratory, California Institute of Technology, under a contract with the National Aeronautics and Space Administration. A part of the research was carried out at the Max-Planck-Institut für Sonnensystemforschung with financial support from Deutsches Zentrum für Luft- und Raumfarht and Max-Planck-Gesellschaft. Parts of the research were carried out by LESIA and LERMA, Observatoire de Paris, with financial support from CNES and CNRS/Institut des sciences de l’univers. A part of the research was carried out at the National Central University with funding from the Taiwanese National Science Counsel grant NSC 101-2111-M-008-016. A part of the research was carried out at the University of Massachusetts, Amherst, USA. We thank Y. Anderson, T. Koch, R. Nowicki, L. Pan, P. Springer and Lucas Kamp for their efforts in scheduling, operations, and support of the MIRO instrument. We specially want to thank all the MIRO engineers, researchers, CoI who participatedto the development of the MIRO instrument and passed away since the beginning of the project/mission : we have ourbest thoughts for Sonia Khatri, Lucas Kamp and Mark Allen from JPL and Maurice Gheudin at Paris Observatory. We thank the Odin Team (A. Sandqvist, S. Lundin, U. Frisk, et al.) for scheduling special observations of comet 67P in support of the Rosetta mission in November 2015. Odin is a Swedish-led satellite project funded jointly by the Swedish National Space Board (SNSB), the Canadian Space Agency (CSA), the National Technology Agency of Finland (Tekes) and the Centre National d’Études Spatiales (CNES, France). The Swedish Space Corporation is the prime contractor, also responsible for Odin operations. The data were reduced and analyzed thanks to the use of the GILDAS, class software (http://www.iram.fr/IRAMFR/GILDAS).
Appendix A Additional tables
Inner coma maps of comet 67P/Churyumov-Gerasimenko.
Parameters derived from observations for the outgassing pattern (H O) and temperature.
2D Gaussian fit to the jet (a) outgassing pattern and derived production rate.
Production rates Qj for the jet alone based on derived or assumed jet width and angular peak production rate derived from line intensities along the jet (± 30°).
Line-of-sight abundances relative to water derived from nadir pointing.
Appendix B Maps of H O emission (and H
 O on 29 July 2014)
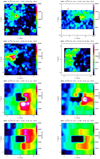 |
Fig. B.1 Maps of interpolated H |
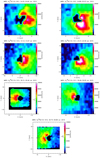 |
Fig. B.2 Maps of interpolated H |
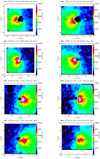 |
Fig. B.3 Maps of interpolated H |
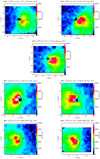 |
Fig. B.4 Maps of interpolated H |
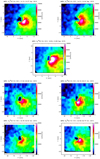 |
Fig. B.5 Maps of interpolated H |
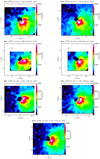 |
Fig. B.6 Maps of interpolated H |
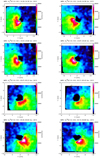 |
Fig. B.7 Maps of interpolated H |
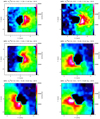 |
Fig. B.8 Maps of interpolated H |
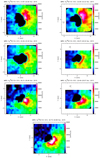 |
Fig. B.9 Maps of interpolated H |
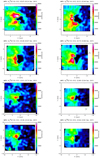 |
Fig. B.10 Maps of interpolated H |
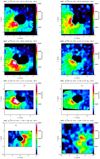 |
Fig. B.11 Maps of interpolated H |
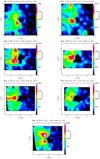 |
Fig. B.12 Maps of interpolated H |
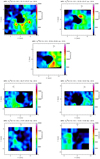 |
Fig. B.13 Maps of interpolated H |
 |
Fig. B.14 Maps (daily average) of interpolated H |
 |
Fig. B.15 Map of interpolated H |
Appendix C Temperature maps: peak value Tmb
of the H O line
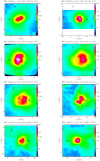 |
Fig. C.1 Sample of the interpolated maps of the peak intensity of the H |
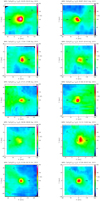 |
Fig. C.1 continued. |
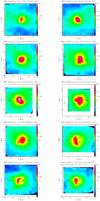 |
Fig. C.1 continued. |
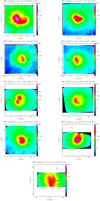 |
Fig. C.1 continued. |
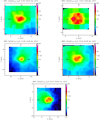 |
Fig. C.1 continued. |
Appendix D Column densities measured across the jet or night side
In this section we show the evolution of the derived column densities across the night- or day-side of the coma along the projected axis of the jet. The shaded region corresponds to pointings with the nucleus in the background. Column densities with the nucleus in the background are estimated for an altitude above 2 km from the center of the nucleus. They are very uncertain because the density cannot be precisely evaluated for the warm gas close to the surface.
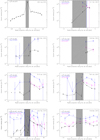 |
Fig. D.1 H |
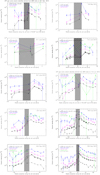 |
Fig. D.1 continued. |
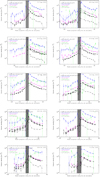 |
Fig. D.1 continued. |
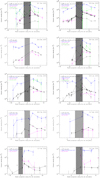 |
Fig. D.1 continued. |
Appendix E Examples of nadir pointing spectra
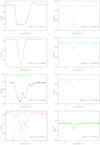 |
Fig. E.1 Nadir pointing spectra obtained between 30.51 and 31.00 August 2015. The vertical scale is main beam brightness temperature in K. The horizontal scale is Doppler velocity relative to the nucleus. Lines are seen in absorption against the nucleus background temperature at 209 K and are blueshifted by −0.8 km s−1
because most of the gas flows toward MIRO/Rosetta. The position and expected relative intensities of the hyperfine components of the H |
References
- Accomazzo, A., Ferri, P., Lodiot, S., et al. 2016, Acta Astronaut., 126, 190 [NASA ADS] [CrossRef] [Google Scholar]
- Accomazzo, A., Ferri, P., Lodiot, S., et al. 2017, Acta Astronaut., 136, 354 [NASA ADS] [CrossRef] [Google Scholar]
- Altwegg, K., Balsiger, H., Bar-Nun, A., et al. 2015, Science, 347, 1261952 [Google Scholar]
- Bieler, A., Altwegg, K., Balsiger, H., et al., 2015, Nature, 526, 678 [Google Scholar]
- Biver, N., Bockelée-Morvan, D., Colom, P., et al. 2002, Earth Moon Planets, 90, 5 [NASA ADS] [CrossRef] [Google Scholar]
- Biver, N., Bockelée-Morvan, D., Crovisier, J., et al. 2006, A&A, 449, 1255 [NASA ADS] [CrossRef] [EDP Sciences] [Google Scholar]
- Biver, N., Bockelée-Morvan, D., Crovisier, J., et al. 2007, Planet. Space Sci., 55, 1058 [NASA ADS] [CrossRef] [Google Scholar]
- Biver, N., Bockelée-Morvan, D., Colom, P., et al. 2011, A&A, 528, A142 [NASA ADS] [CrossRef] [EDP Sciences] [Google Scholar]
- Biver, N., Crovisier, J., Bockelée-Morvan, D., et al. 2012, A&A, 539, A68 [NASA ADS] [CrossRef] [EDP Sciences] [Google Scholar]
- Biver, N., Hofstadter, M., Gulkis, S., et al. 2015, A&A, 583, A3 [NASA ADS] [CrossRef] [EDP Sciences] [Google Scholar]
- Biver, N., Moreno, R., Bockelée-Morvan, D., et al. 2016, A&A, 589, A78 [NASA ADS] [CrossRef] [EDP Sciences] [Google Scholar]
- Bockelée-Morvan, D., & Biver, N. 2017, Phil. Trans. R. Soc. A, 375, 20160252 [NASA ADS] [CrossRef] [Google Scholar]
- Bockelée-Morvan, D., Crovisier, J., Mumma, M. J., & Weaver, H. A. 2004, in Comets II, eds. M. C. Festou, H. U. Keller, & H. A. Weaver (Tucson, AZ: University of Arizona Press), 391 [Google Scholar]
- Bockelée-Morvan, D., Biver, N., Swinyard, B., et al. 2012, A&A, 544, L15 [NASA ADS] [CrossRef] [EDP Sciences] [Google Scholar]
- Bockelée-Morvan, D., Debout, V., Erard, S., et al. 2015a, A&A, 583, A6 [NASA ADS] [CrossRef] [EDP Sciences] [Google Scholar]
- Bockelée-Morvan, D., Calmonte, U., Charnley, S., et al. 2015b, Space Sci. Rev., 197, 47 [NASA ADS] [CrossRef] [Google Scholar]
- Bockelée-Morvan, D., Crovisier, J., Erard, S., et al. 2016, MNRAS, 462, S170 [Google Scholar]
- Calmonte, U., Altwegg, K., Balsiger, H., et al. 2016, MNRAS, 462, S253 [CrossRef] [Google Scholar]
- Cazzoli, G., Dore, L., & Puzzarini, C. 2009, A&A, 507, 1707 [NASA ADS] [CrossRef] [EDP Sciences] [Google Scholar]
- Choukroun, M., Kheim, S., Schloerb, F. P., et al. 2015, A&A, 583, A28 [NASA ADS] [CrossRef] [EDP Sciences] [Google Scholar]
- Crifo, J.-F., & Slanina, Z. 1991, ApJ, 383, 351 [NASA ADS] [CrossRef] [Google Scholar]
- Dello Russo, N., Kawakita, H., Vervack, R. J., & Weaver, H. A., 2016, Icarus, 278, 301 [NASA ADS] [CrossRef] [Google Scholar]
- Feldman, P. D., A’Hearn, M. F., Bertaux, J.-L., et al. 2018, AJ, 155, 9 [NASA ADS] [CrossRef] [Google Scholar]
- Fougere, N., Altwegg, K., Berthelier, J.-J., et al. 2016, MNRAS, 462, S156 [CrossRef] [Google Scholar]
- Frisk, U., Hagström, M., Ala-Laurinaho, J., et al. 2003, A&A, 402, L27 [NASA ADS] [CrossRef] [EDP Sciences] [Google Scholar]
- Fulle, M., Blum, J., Green, S. F., et al. 2019, MNRAS, 482, 3326 [NASA ADS] [CrossRef] [Google Scholar]
- Gasc, S., Altwegg, K., Balsiger, H., et al. 2017, MNRAS, 469, S108 [Google Scholar]
- Giorgini, J. D., Chamberlin, A. B., & Park, S. B., JPL Solar System Dynamics Group, Horizons On-Line Ephemeris System (https://ssd.jpl.nasa.gov/horizons.cgi) [Google Scholar]
- Grün, E., Agarwal, J., Altobelli, N., et al. 2016, MNRAS, 462, S220 [CrossRef] [Google Scholar]
- Gulkis, S., Frerking, M., Crovisier, J., et al. 2007, Space Sci. Rev., 128, 56 [Google Scholar]
- Gulkis, S., Allen, M., von Allmen, P., et al. 2015, Science, 347, aaa0709 [Google Scholar]
- Hansen, K. C., Altwegg, K., Berthelier, J.-J., et al. 2016, MNRAS, 462, S491 [Google Scholar]
- Heritier, K. L., Henri, P., Vallières, X., et al. 2017, MNRAS, 469, S118 [CrossRef] [Google Scholar]
- Hoang, M., Altwegg, K., Balsiger, H., et al. 2017, A&A, 600, A77 [NASA ADS] [CrossRef] [EDP Sciences] [Google Scholar]
- Jorda, L., Gaskell, R., Capanna, C., et al. 2016, Icarus, 277, 257 [NASA ADS] [CrossRef] [Google Scholar]
- Keller, H. U., Mottola, S., Hviid, S. F., et al. 2017, MNRAS, 469, S357 [CrossRef] [Google Scholar]
- Koschny, D., Dhiri, V., Wirth, K., et al. 2007, Space Sci. Rev., 128, 167 [NASA ADS] [CrossRef] [Google Scholar]
- Läuter, M., Kramer, T., Rubin, M., & Altwegg, K. 2019, MNRAS, 483, 852 [Google Scholar]
- Le Roy, L., Altwegg, K., Balsiger, H., et al. 2015, A&A, 583, A1 [NASA ADS] [CrossRef] [EDP Sciences] [Google Scholar]
- Lee, S., von Allmen, P., Allen, M., et al. 2015, A&A, 583, A5 [NASA ADS] [CrossRef] [EDP Sciences] [Google Scholar]
- Marshall, D. W., Hartogh, P., Rezac, L., et al. 2017, A&A, 603, A87 [NASA ADS] [CrossRef] [EDP Sciences] [Google Scholar]
- Migliorini, A., Piccioni, G., Capaccioni, F., et al. 2016, A&A, 589, A45 [NASA ADS] [CrossRef] [EDP Sciences] [Google Scholar]
- Mumma, M. J., & Charnley, S. B. 2011, ARA&A, 49, 471 [NASA ADS] [CrossRef] [Google Scholar]
- Nordh, H. L., von Schéele, F., Frisk, U., et al. 2003, A&A, 402, L21 [NASA ADS] [CrossRef] [EDP Sciences] [Google Scholar]
- Paquette, J. A., Engrand, C., Hilchenbach, M., et al. 2018, MNRAS, 477, 3836 [NASA ADS] [CrossRef] [Google Scholar]
- Pätzold, M., Andert, T. P., Hahn, M., et al. 2019, MNRAS, 483, 2337 [NASA ADS] [CrossRef] [Google Scholar]
- Peusker, F., Scholten, F., Matz, K.-D., et al. 2017, A&A, 607, L1 [NASA ADS] [CrossRef] [EDP Sciences] [Google Scholar]
- Puzzarini, C., Cazzoli, G., Harding, M. E., Vázquez, J., & Gauss, J. 2009, J. Chem. Phys., 131, 234304 [NASA ADS] [CrossRef] [PubMed] [Google Scholar]
- Schloerb, P., Spilker, T., Lellouch, E., et al. 2015, A&A, 583, A29 [NASA ADS] [CrossRef] [EDP Sciences] [Google Scholar]
- Schroeder, I. R. H. G., Altwegg, K., Balsiger, H., et al. 2019, A&A, 630, A29 (Rosetta 2 SI) [NASA ADS] [CrossRef] [EDP Sciences] [Google Scholar]
- Snodgrass, C., A’Hearn, M. F., Aceituno, F., et al. 2016, Phil. Trans. R. Soc. London, Ser. A, 375, 2097 [Google Scholar]
- Vincent, J.-B., A’Hearn, M. F., Lin, Z.-Y., et al. 2016, MNRAS, 462, 184 [Google Scholar]
- Yamamoto, T. 1985, A&A, 142, 31 [NASA ADS] [Google Scholar]
- Zakharov, V., Bockelée-Morvan, D., Biver, N., Crovisier, J., & Lecacheux, A. 2007, A&A, 473, 303 [NASA ADS] [CrossRef] [EDP Sciences] [Google Scholar]
All Tables
Parameters derived from observations for the outgassing pattern (H O) and temperature.
Production rates Qj for the jet alone based on derived or assumed jet width and angular peak production rate derived from line intensities along the jet (± 30°).
All Figures
 |
Fig. 1 Examples of schemes used to scan the coma of 67P with Rosetta/MIRO. Each circle has the projected size of the MIRO beam width (7.5′) at the distance of the comet and is projected at the pointed position at the center of the 30 s integration. The scales of the
X- and Y -axes are the distance from comet center. Arrows show the scanning direction and its motion during 30 s. The color provides the H |
| In the text | |
 |
Fig. 2 Spectra of H |
| In the text | |
 |
Fig. 3 Intensity measured at − 0.8 km s−1 on saturated H |
| In the text | |
 |
Fig. 4 Geometric parameters defining the jet and its appearance on the plane of the sky, defined by the Rosetta X- and Y-axis. The +Y direction is closest to the north pole and the Sun is either in the +X or -X direction (PA = 90° or 270°). |
| In the text | |
 |
Fig. 5 Mean gas expansion velocity measured for the jet as given in Table A.2. These values were used to invert the lines profiles and compute production rates for all molecules. Filled blue dots show pre-perihelion data and empty black symbols represent post-perihelion observations. The fitted power laws are
|
| In the text | |
 |
Fig. 6 Example of a radial profile of the rotational temperature Trot(CH3OH) as a functionof projected distance ρ
from the nucleus in the jet (see text). The empty circles correspond to the entire line profile, and the blue, green, black, red, and pink dots correspond to rotational temperatures measured in bins of Doppler velocity of
(−V ; −0.6V),
(−0.6V ;−0.2V),
(−0.2V ;+0.2V),
(+0.2V ;+0.6V), and (+0.6V ;+V), respectively, where V is either the average expansion velocity or half the FWHM of the line. Each velocity bin samples gas either closer to (vi < 0) or farther away (vi > 0) from the plane of the sky, i.e., at a cometocentric distance r
larger than the projected distance ρ:
r
= |
| In the text | |
 |
Fig. 7 Top panel: example of a radial profile of the peak intensity Tmb
of the saturated H |
| In the text | |
 |
Fig. 8 Illustration of step 1 of the data analysis: azimuthal cut of the 14.31–14.44 September 2015 UT map of H |
| In the text | |
 |
Fig. 9 Illustration of step 4 of data analysis. Top panel: jet. Extracted spectra of H |
| In the text | |
 |
Fig. 10 Illustration of step 5 of data analysis for the jet. Top panel: extracted spectra of H |
| In the text | |
 |
Fig. 11 Same as Fig. 10 for the night side. Extracted spectra of H |
| In the text | |
 |
Fig. 12 Illustration of step 5 of data analysis. Polar plot representation of the derived angular production rate q(ϕ) for the 7.5–10 km projected radius range. The maximum of production (q = 3.5 × 1024 molec. s−1sr−1) is towards a colatitude angle of ≈110°, slightly away from the direction of Rosetta. |
| In the text | |
 |
Fig. 13 Step 6: combining results of step 5 for each range of projected radius. Derived angular production rate
q(ϕ) for the H |
| In the text | |
 |
Fig. 14 Top panel: simulated optically thin (QNH_3 = 2.25 × 1024 molec. s−1) NH3 line (in black); the Doppler profile of the F(2 − 1) component is shown in pink. The dotted lines show the estimated F(0 − 1) (green), F(1 − 1) (light blue), and F(2 − 1) (red) profiles by the deconvolution routine. The adopted retrieved profile for the F(2 − 1) component alone from the deconvolution process is shown in bold dark blue. This is the average of the subtraction result of the estimated F(0 − 1) and F(1 − 1) profile from the full line and estimated F(2 − 1) (red) profile.Middle panel: same as above, but for QNH_3 = 22.5 × 1024 molec. s−1 with strong optical effects, which results in slight differences between the retrieved bold dark blue profile and the simulated pink profile. This corresponds to the highest opacity case encountered for this line. Bottom panel: NH3 line observed on 30.31–30.65 July 2015 (black), and the deconvolved Doppler profiles of the hyperfine components (same color coding as above plots). The position and relative intensities of the three hyperfine components are indicated below the line, and their identification is indicated above. |
| In the text | |
 |
Fig. 15 Illustration of step 5 of the data analysis for a deconvolved NH3 line profile. See the caption of Fig. 10 for the three upper plots, and the caption of Fig. 12 for the bottom plot. |
| In the text | |
 |
Fig. 16 Top panel: abundances of CH3OH, CO, and NH3 relative to water as a function of the sub-spacecraft cometocentric latitude during the nadir pointing. The selected time interval (19 June–10 October 2015) corresponds to a four-month period around perihelion. Bottom panel: same as above for the time interval of 21 November 2015–24 February 2016, four months after perihelion. |
| In the text | |
 |
Fig. 17 Total production rates of water (black, assumed to be |
| In the text | |
 |
Fig. 18 Top panel: retrieved total water production rate as a function of the projected distance
ρ
from the center of the nucleus, based on selected rings in the two maps of H |
| In the text | |
 |
Fig. 19 Production rates ratio of H |
| In the text | |
 |
Fig. 20 Evolution of the mean latitude of the bulk of outgassing (jet) water, methanol, and ammonia from July 2014 to September 2016. The red stars show the latitude of the subsolar point, which crosses the equator at the comet equinoxes, 95 days before perihelion and 220 days after. The green dotted line corresponds to the average latitude of the facets that receive the maximum solar flux. |
| In the text | |
 |
Fig. 21 Evolution of the mean angular extent of the bulk of outgassing (jet FWHM) water, methanol, and ammonia from July 2014 toSeptember 2016. Representative values of the extent of the solid angle of the jet (non-linear scale) are given on the right. |
| In the text | |
 |
Fig. 22 Heliocentric evolution of the total production rates of water (black, assumed to be 500 × QH218O), methanol (cyan), carbon monoxide (green), and ammonia (magenta) from July 2014 to September 2016, based on mapping data. The horizontal scale is the heliocentric distance (pre-perihelion on the left, and post-perihelion on the right). Empty down-pointing triangles correspond to 3σ upper limits. Dotted lines are power-law fits to the heliocentric evolution (see Table 5). |
| In the text | |
 |
Fig. 23 Evolution of the abundances relative to water of methanol, ammonia, and CO in the coma from July 2014 to September 2016. The larger symbols are based on the global outgassing rates derived from mapping data. Additional more local measurements from nadir or single lines of sight are shown by smaller symbols in the upper panel. Empty down-pointing triangles correspond to 3σ upper limits.Bottom panel: zoom over ± 200 days aroundperihelion. |
| In the text | |
 |
Fig. 24 Cumulative water mass-loss rate of comet 67P from July 2014 to September 2016. About 40% more mass is lost post-perihelion than pre-perihelion (~1.4 vs. 1 million tons), but mid-point (50% cumulative loss) is close to the solstice (vertical red dotted line). Ninety-eight percent of the mass is cumulatively lost within ±200 days from perihelion, and 95% between the two equinoxes (vertical blue dotted lines). The total water loss is 2.42 ± 0.04 × 10⁹ kg. |
| In the text | |
 |
Fig. 25 Same as Fig. 24 for methanol, carbon monoxide, and ammonia. The vertical dotted lines indicate the times of the equinoxes (blue) and solstice (red). Only 25% of the mass of methanol and CO has been cumulatively lost at perihelion time. The emission of methanol does not decrease as quickly as for ammonia. The orbit-integrated mass losses at the last points are 66 ± 3, 25 ± 8, and 8.1 ± 0.2 × 10⁶ kg for CH3OH, CO, and NH3, respectively. |
| In the text | |
 |
Fig. B.1 Maps of interpolated H |
| In the text | |
 |
Fig. B.2 Maps of interpolated H |
| In the text | |
 |
Fig. B.3 Maps of interpolated H |
| In the text | |
 |
Fig. B.4 Maps of interpolated H |
| In the text | |
 |
Fig. B.5 Maps of interpolated H |
| In the text | |
 |
Fig. B.6 Maps of interpolated H |
| In the text | |
 |
Fig. B.7 Maps of interpolated H |
| In the text | |
 |
Fig. B.8 Maps of interpolated H |
| In the text | |
 |
Fig. B.9 Maps of interpolated H |
| In the text | |
 |
Fig. B.10 Maps of interpolated H |
| In the text | |
 |
Fig. B.11 Maps of interpolated H |
| In the text | |
 |
Fig. B.12 Maps of interpolated H |
| In the text | |
 |
Fig. B.13 Maps of interpolated H |
| In the text | |
 |
Fig. B.14 Maps (daily average) of interpolated H |
| In the text | |
 |
Fig. B.15 Map of interpolated H |
| In the text | |
 |
Fig. C.1 Sample of the interpolated maps of the peak intensity of the H |
| In the text | |
 |
Fig. C.1 continued. |
| In the text | |
 |
Fig. C.1 continued. |
| In the text | |
 |
Fig. C.1 continued. |
| In the text | |
 |
Fig. C.1 continued. |
| In the text | |
 |
Fig. D.1 H |
| In the text | |
 |
Fig. D.1 continued. |
| In the text | |
 |
Fig. D.1 continued. |
| In the text | |
 |
Fig. D.1 continued. |
| In the text | |
 |
Fig. E.1 Nadir pointing spectra obtained between 30.51 and 31.00 August 2015. The vertical scale is main beam brightness temperature in K. The horizontal scale is Doppler velocity relative to the nucleus. Lines are seen in absorption against the nucleus background temperature at 209 K and are blueshifted by −0.8 km s−1
because most of the gas flows toward MIRO/Rosetta. The position and expected relative intensities of the hyperfine components of the H |
| In the text | |
Current usage metrics show cumulative count of Article Views (full-text article views including HTML views, PDF and ePub downloads, according to the available data) and Abstracts Views on Vision4Press platform.
Data correspond to usage on the plateform after 2015. The current usage metrics is available 48-96 hours after online publication and is updated daily on week days.
Initial download of the metrics may take a while.


