Fig. 22
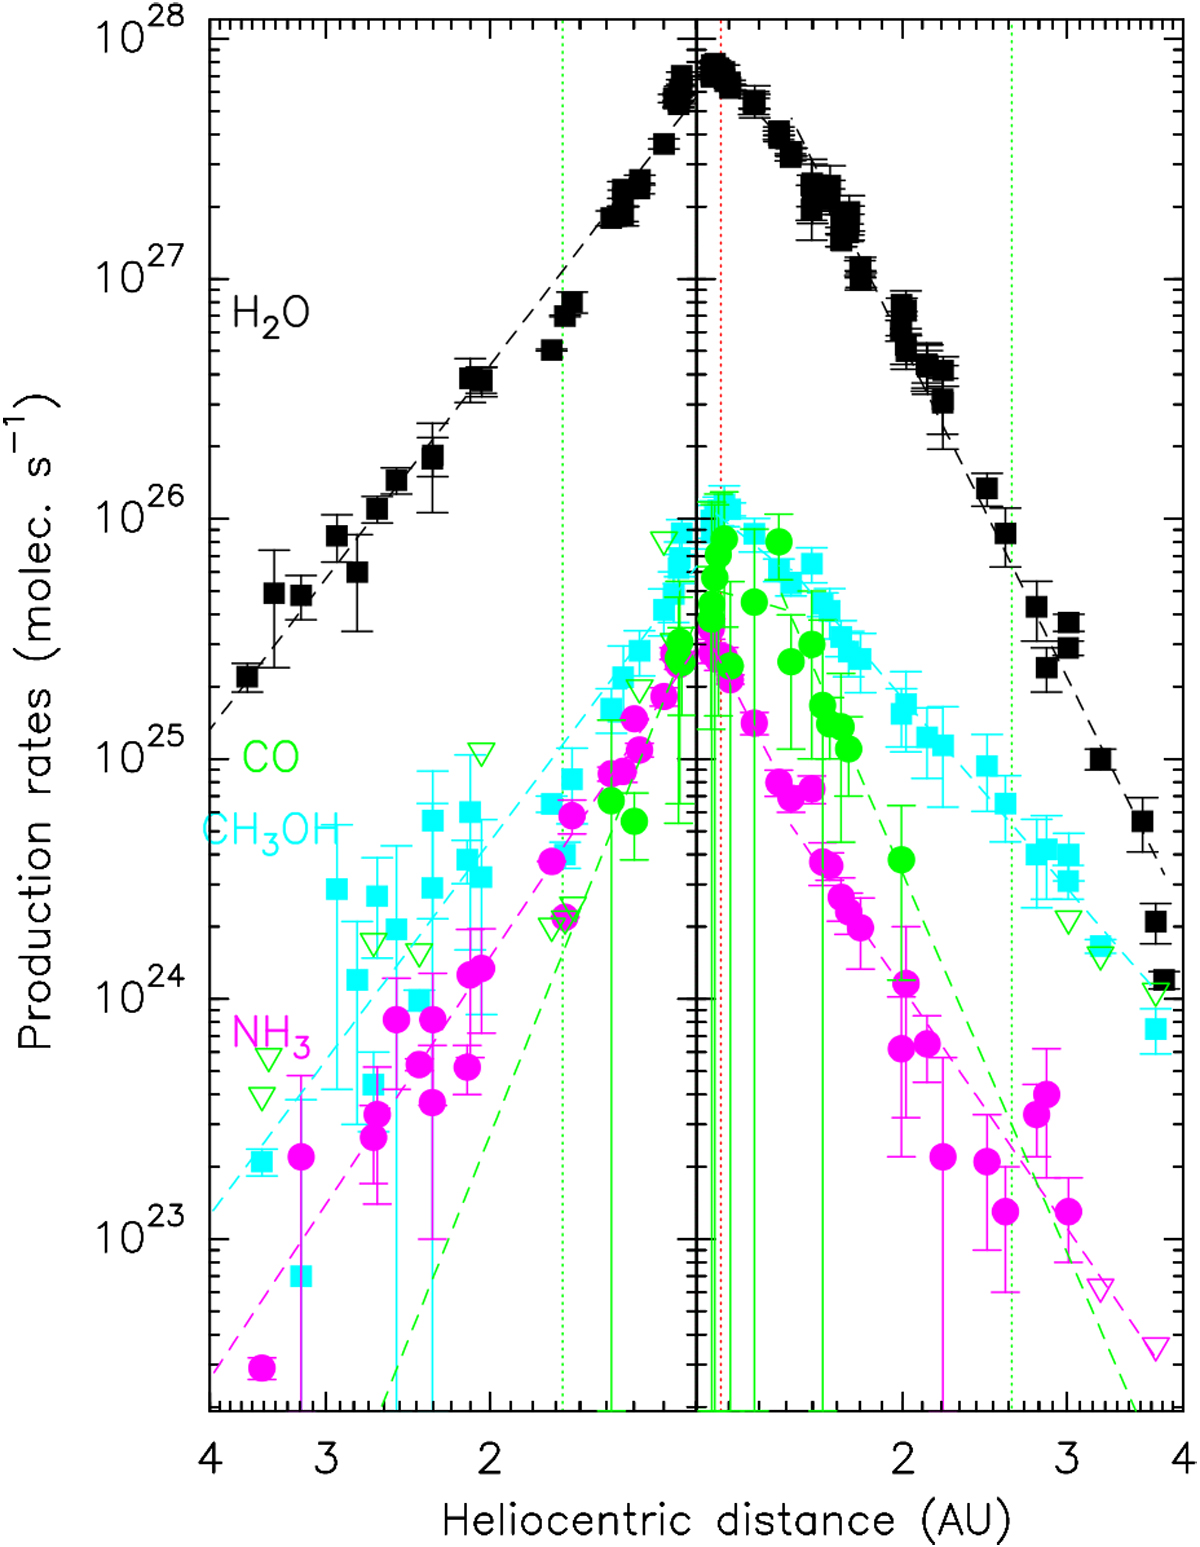
Heliocentric evolution of the total production rates of water (black, assumed to be 500 × QH218O), methanol (cyan), carbon monoxide (green), and ammonia (magenta) from July 2014 to September 2016, based on mapping data. The horizontal scale is the heliocentric distance (pre-perihelion on the left, and post-perihelion on the right). Empty down-pointing triangles correspond to 3σ upper limits. Dotted lines are power-law fits to the heliocentric evolution (see Table 5).
Current usage metrics show cumulative count of Article Views (full-text article views including HTML views, PDF and ePub downloads, according to the available data) and Abstracts Views on Vision4Press platform.
Data correspond to usage on the plateform after 2015. The current usage metrics is available 48-96 hours after online publication and is updated daily on week days.
Initial download of the metrics may take a while.