Fig. 14
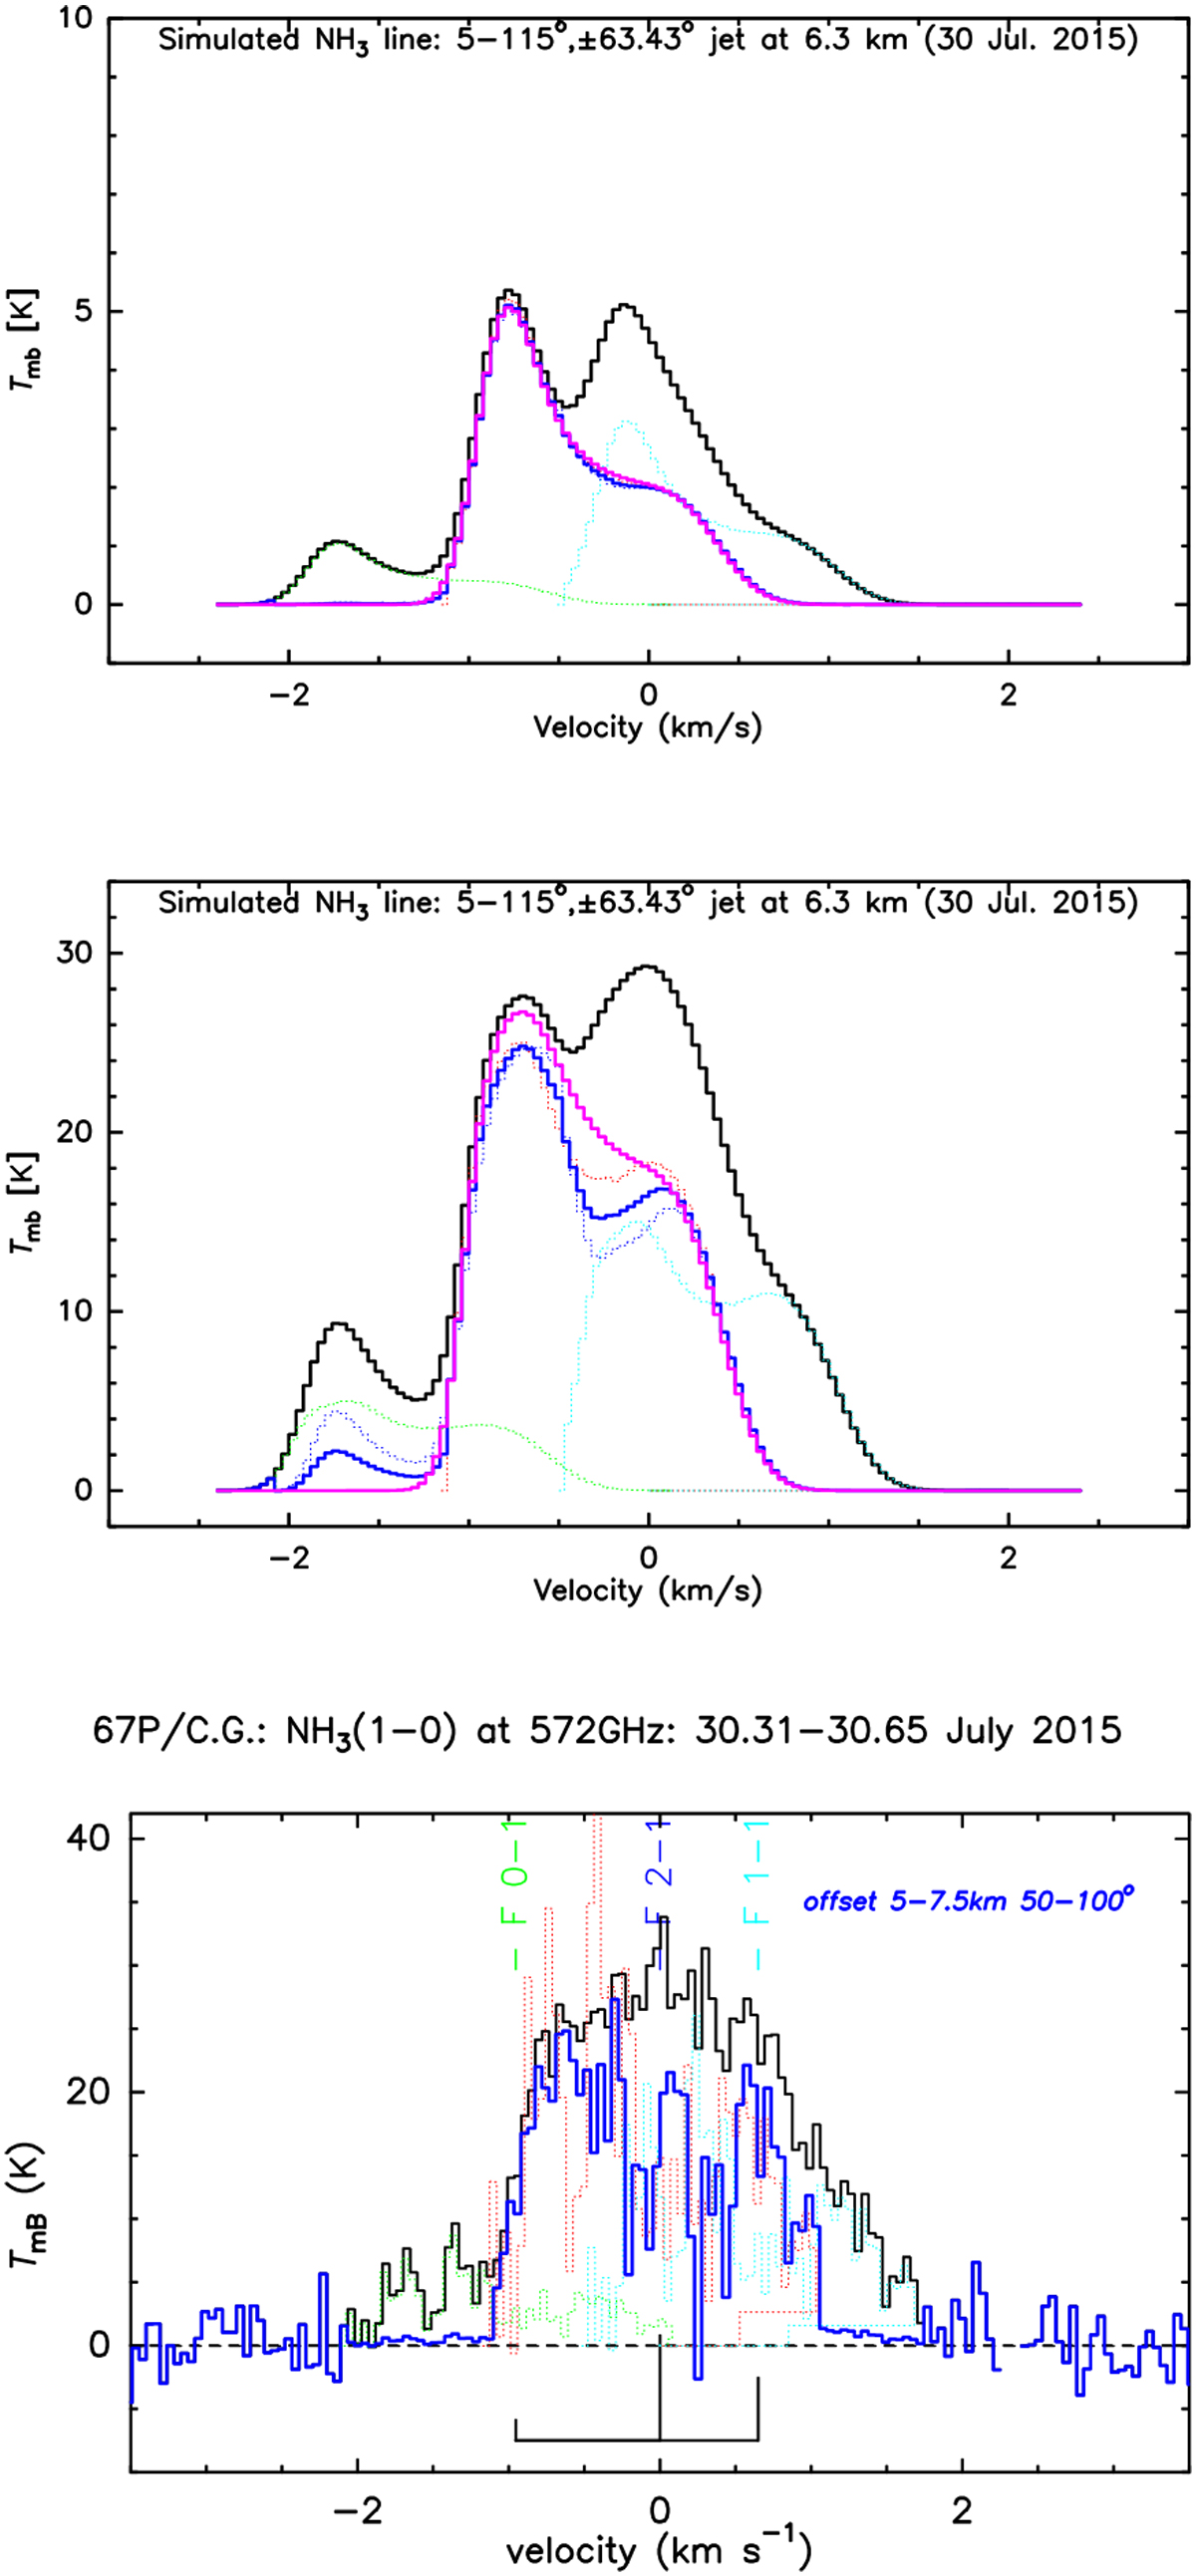
Top panel: simulated optically thin (QNH_3 = 2.25 × 1024 molec. s−1) NH3 line (in black); the Doppler profile of the F(2 − 1) component is shown in pink. The dotted lines show the estimated F(0 − 1) (green), F(1 − 1) (light blue), and F(2 − 1) (red) profiles by the deconvolution routine. The adopted retrieved profile for the F(2 − 1) component alone from the deconvolution process is shown in bold dark blue. This is the average of the subtraction result of the estimated F(0 − 1) and F(1 − 1) profile from the full line and estimated F(2 − 1) (red) profile.Middle panel: same as above, but for QNH_3 = 22.5 × 1024 molec. s−1 with strong optical effects, which results in slight differences between the retrieved bold dark blue profile and the simulated pink profile. This corresponds to the highest opacity case encountered for this line. Bottom panel: NH3 line observed on 30.31–30.65 July 2015 (black), and the deconvolved Doppler profiles of the hyperfine components (same color coding as above plots). The position and relative intensities of the three hyperfine components are indicated below the line, and their identification is indicated above.
Current usage metrics show cumulative count of Article Views (full-text article views including HTML views, PDF and ePub downloads, according to the available data) and Abstracts Views on Vision4Press platform.
Data correspond to usage on the plateform after 2015. The current usage metrics is available 48-96 hours after online publication and is updated daily on week days.
Initial download of the metrics may take a while.