Fig. 6
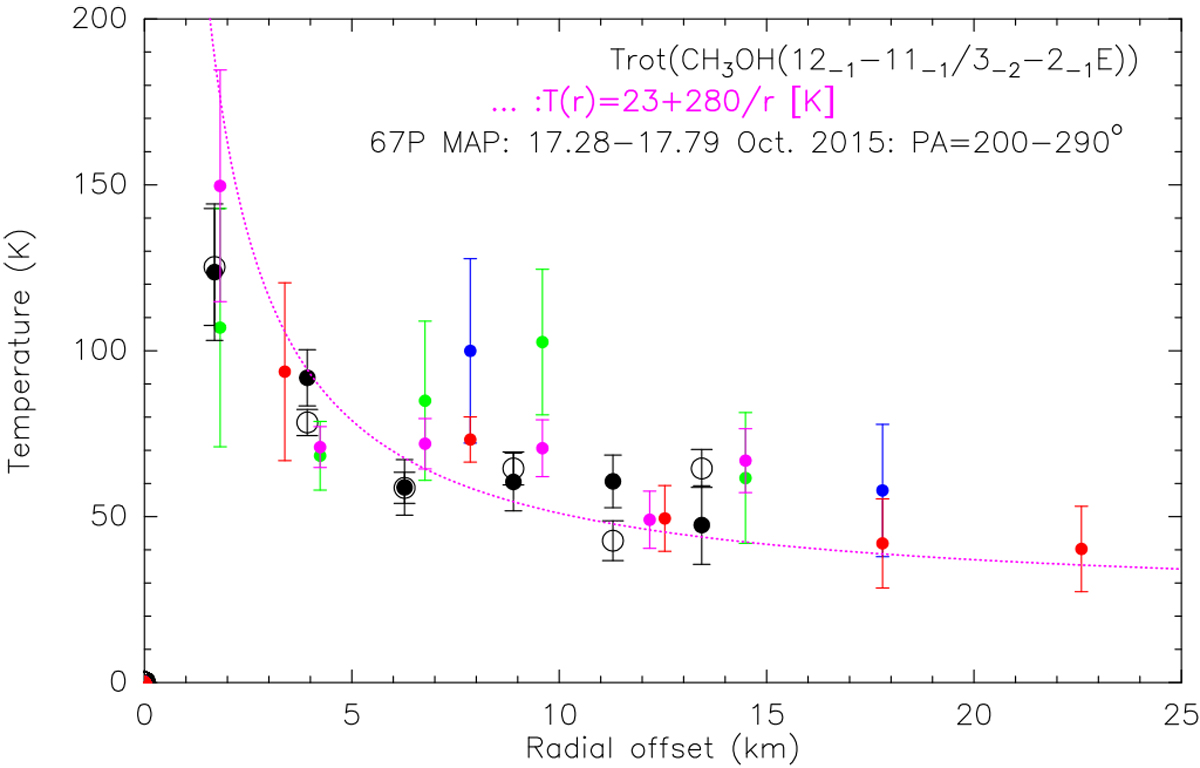
Example of a radial profile of the rotational temperature Trot(CH3OH) as a functionof projected distance ρ
from the nucleus in the jet (see text). The empty circles correspond to the entire line profile, and the blue, green, black, red, and pink dots correspond to rotational temperatures measured in bins of Doppler velocity of
(−V ; −0.6V),
(−0.6V ;−0.2V),
(−0.2V ;+0.2V),
(+0.2V ;+0.6V), and (+0.6V ;+V), respectively, where V is either the average expansion velocity or half the FWHM of the line. Each velocity bin samples gas either closer to (vi < 0) or farther away (vi > 0) from the plane of the sky, i.e., at a cometocentric distance r
larger than the projected distance ρ:
r
= ![]() , where
, where ![]() . These dots are plotted at the corresponding deprojected radii r
of ± 1.667ρ,
± 1.091ρ
or ρ.
. These dots are plotted at the corresponding deprojected radii r
of ± 1.667ρ,
± 1.091ρ
or ρ.
Current usage metrics show cumulative count of Article Views (full-text article views including HTML views, PDF and ePub downloads, according to the available data) and Abstracts Views on Vision4Press platform.
Data correspond to usage on the plateform after 2015. The current usage metrics is available 48-96 hours after online publication and is updated daily on week days.
Initial download of the metrics may take a while.