Fig. 8
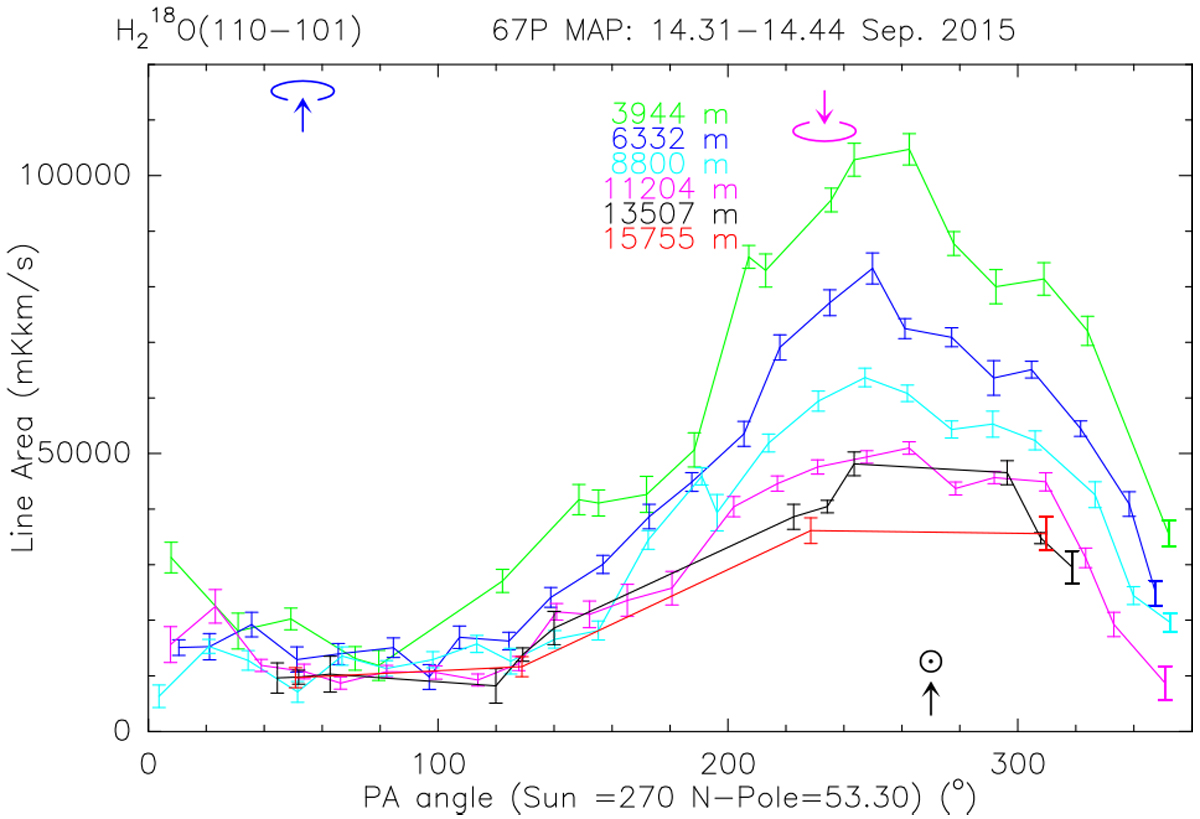
Illustration of step 1 of the data analysis: azimuthal cut of the 14.31–14.44 September 2015 UT map of H![]() O. The line-integrated intensity for lines averaged in bins of 15° in azimuth (PA scale on the horizontal axis) and 2.5 km in projected radius is plotted for each PA and with a different color for each range of radial distance. The projected directions of the Sun, north pole (blue), and south pole (magenta) are indicated.
O. The line-integrated intensity for lines averaged in bins of 15° in azimuth (PA scale on the horizontal axis) and 2.5 km in projected radius is plotted for each PA and with a different color for each range of radial distance. The projected directions of the Sun, north pole (blue), and south pole (magenta) are indicated.
Current usage metrics show cumulative count of Article Views (full-text article views including HTML views, PDF and ePub downloads, according to the available data) and Abstracts Views on Vision4Press platform.
Data correspond to usage on the plateform after 2015. The current usage metrics is available 48-96 hours after online publication and is updated daily on week days.
Initial download of the metrics may take a while.