Fig. 11
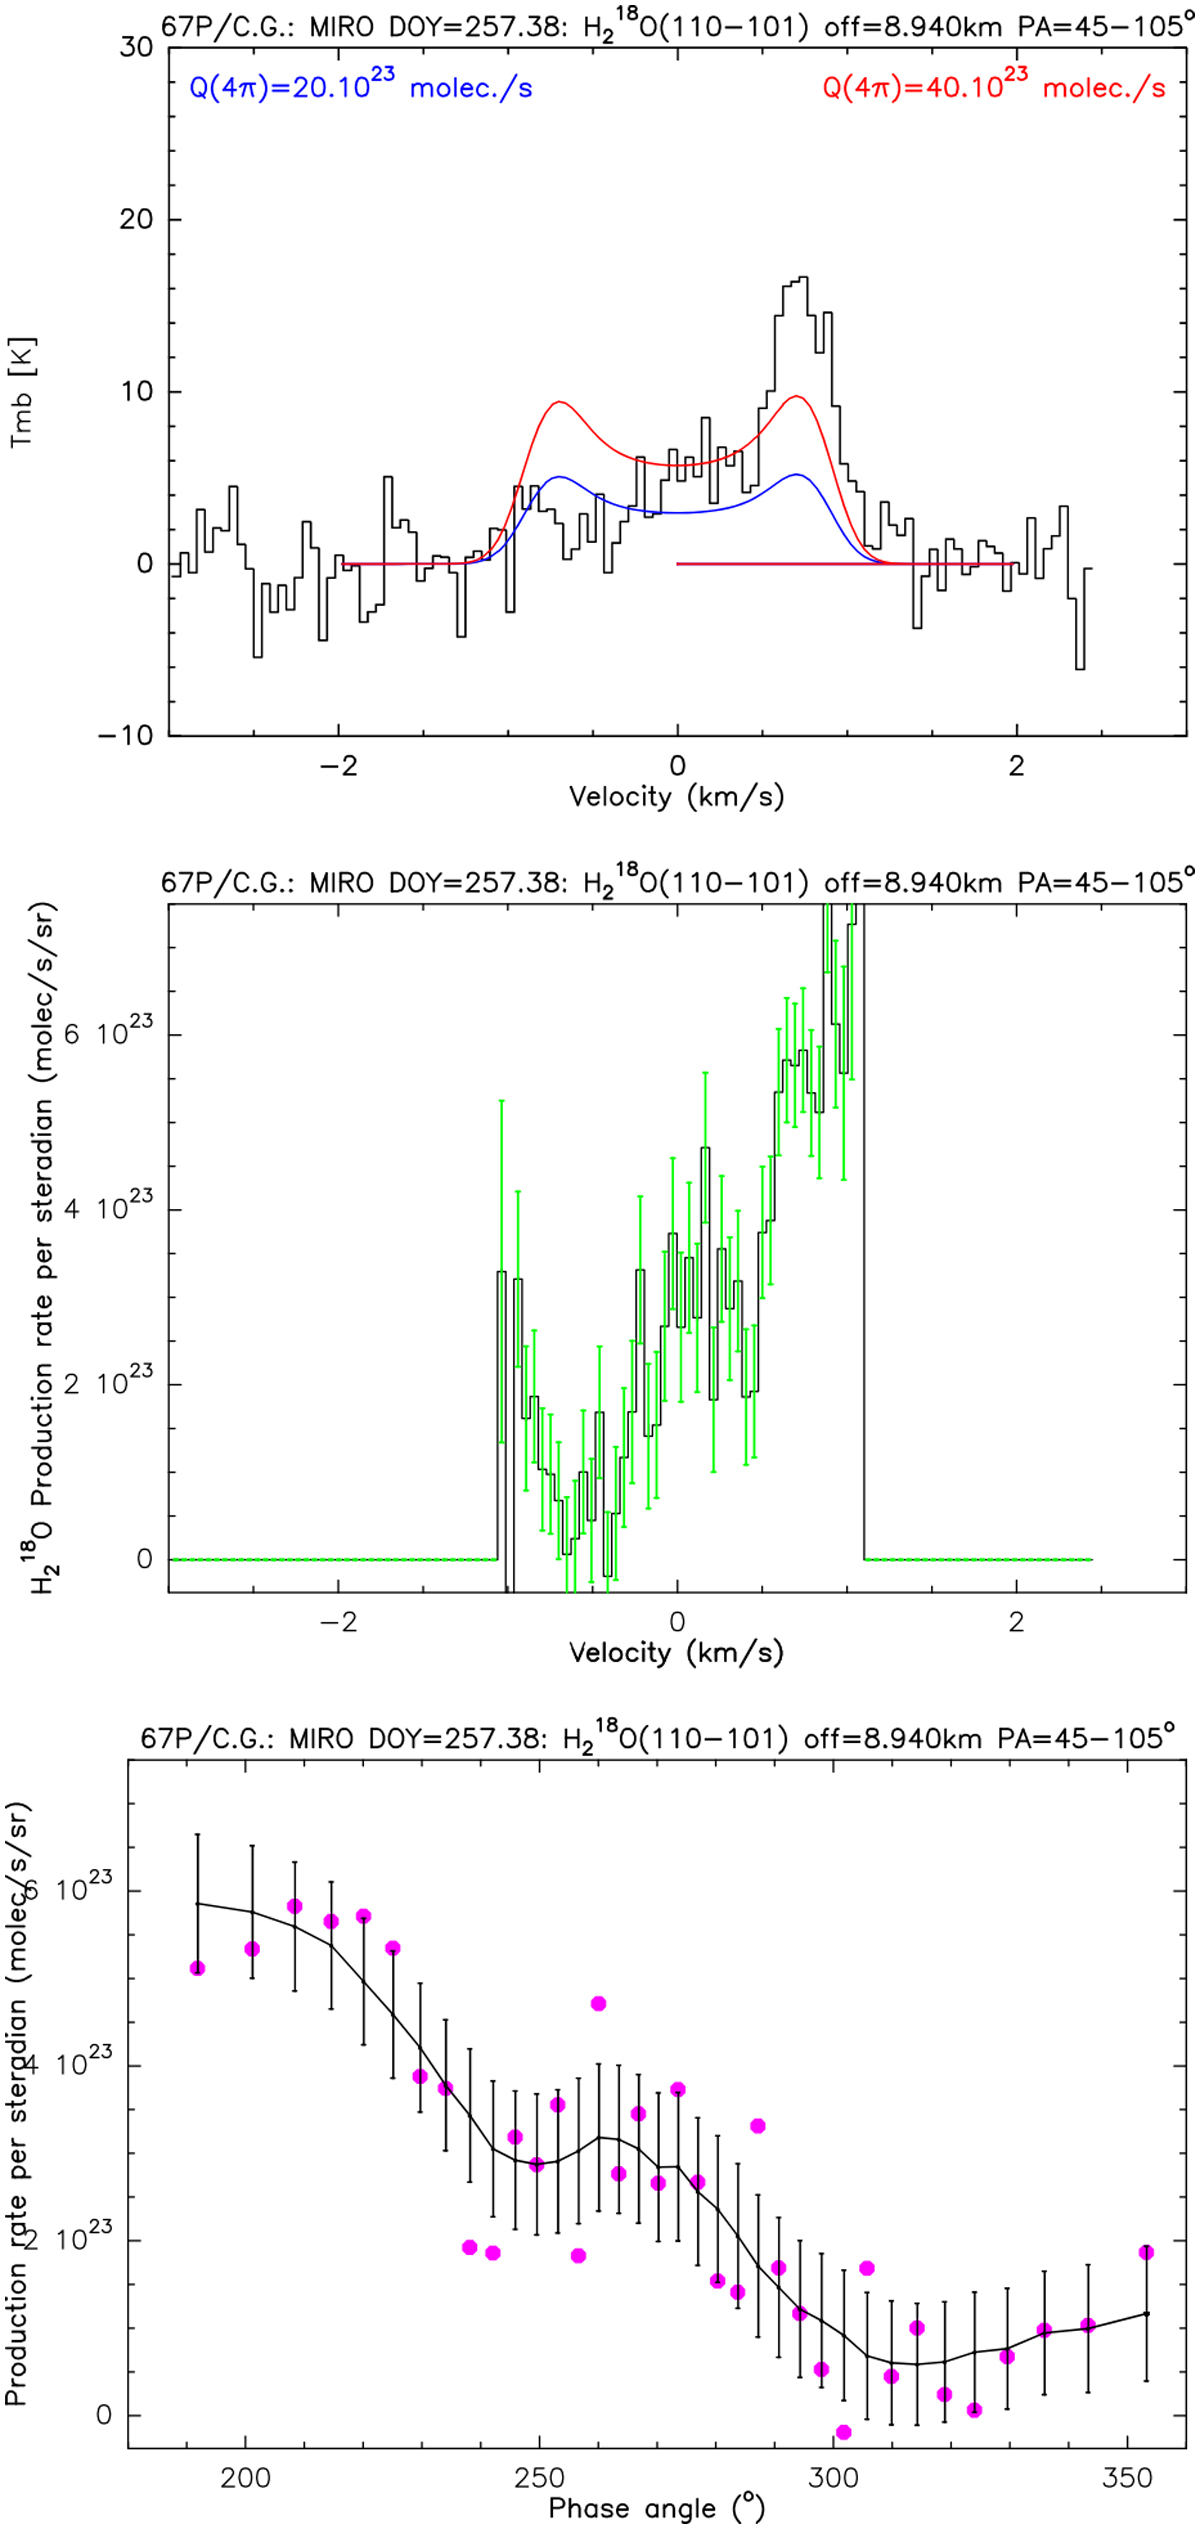
Same as Fig. 10 for the night side. Extracted spectra of H![]() O from the 14.31–14.44 September 2015 UT map, in the [45–105]° range of PA and [7.5–10] km range of projected radius (mean radius of 8.941 km, middle spectrum from Fig. 9). Top panel: isotropic models correspond to
QH218O = 2 × 1024 molec. s−1
(blue) and QH218O = 4 × 1024 molec. s−1
(red).
O from the 14.31–14.44 September 2015 UT map, in the [45–105]° range of PA and [7.5–10] km range of projected radius (mean radius of 8.941 km, middle spectrum from Fig. 9). Top panel: isotropic models correspond to
QH218O = 2 × 1024 molec. s−1
(blue) and QH218O = 4 × 1024 molec. s−1
(red).
Current usage metrics show cumulative count of Article Views (full-text article views including HTML views, PDF and ePub downloads, according to the available data) and Abstracts Views on Vision4Press platform.
Data correspond to usage on the plateform after 2015. The current usage metrics is available 48-96 hours after online publication and is updated daily on week days.
Initial download of the metrics may take a while.