Fig. D.1
H![]() O or H
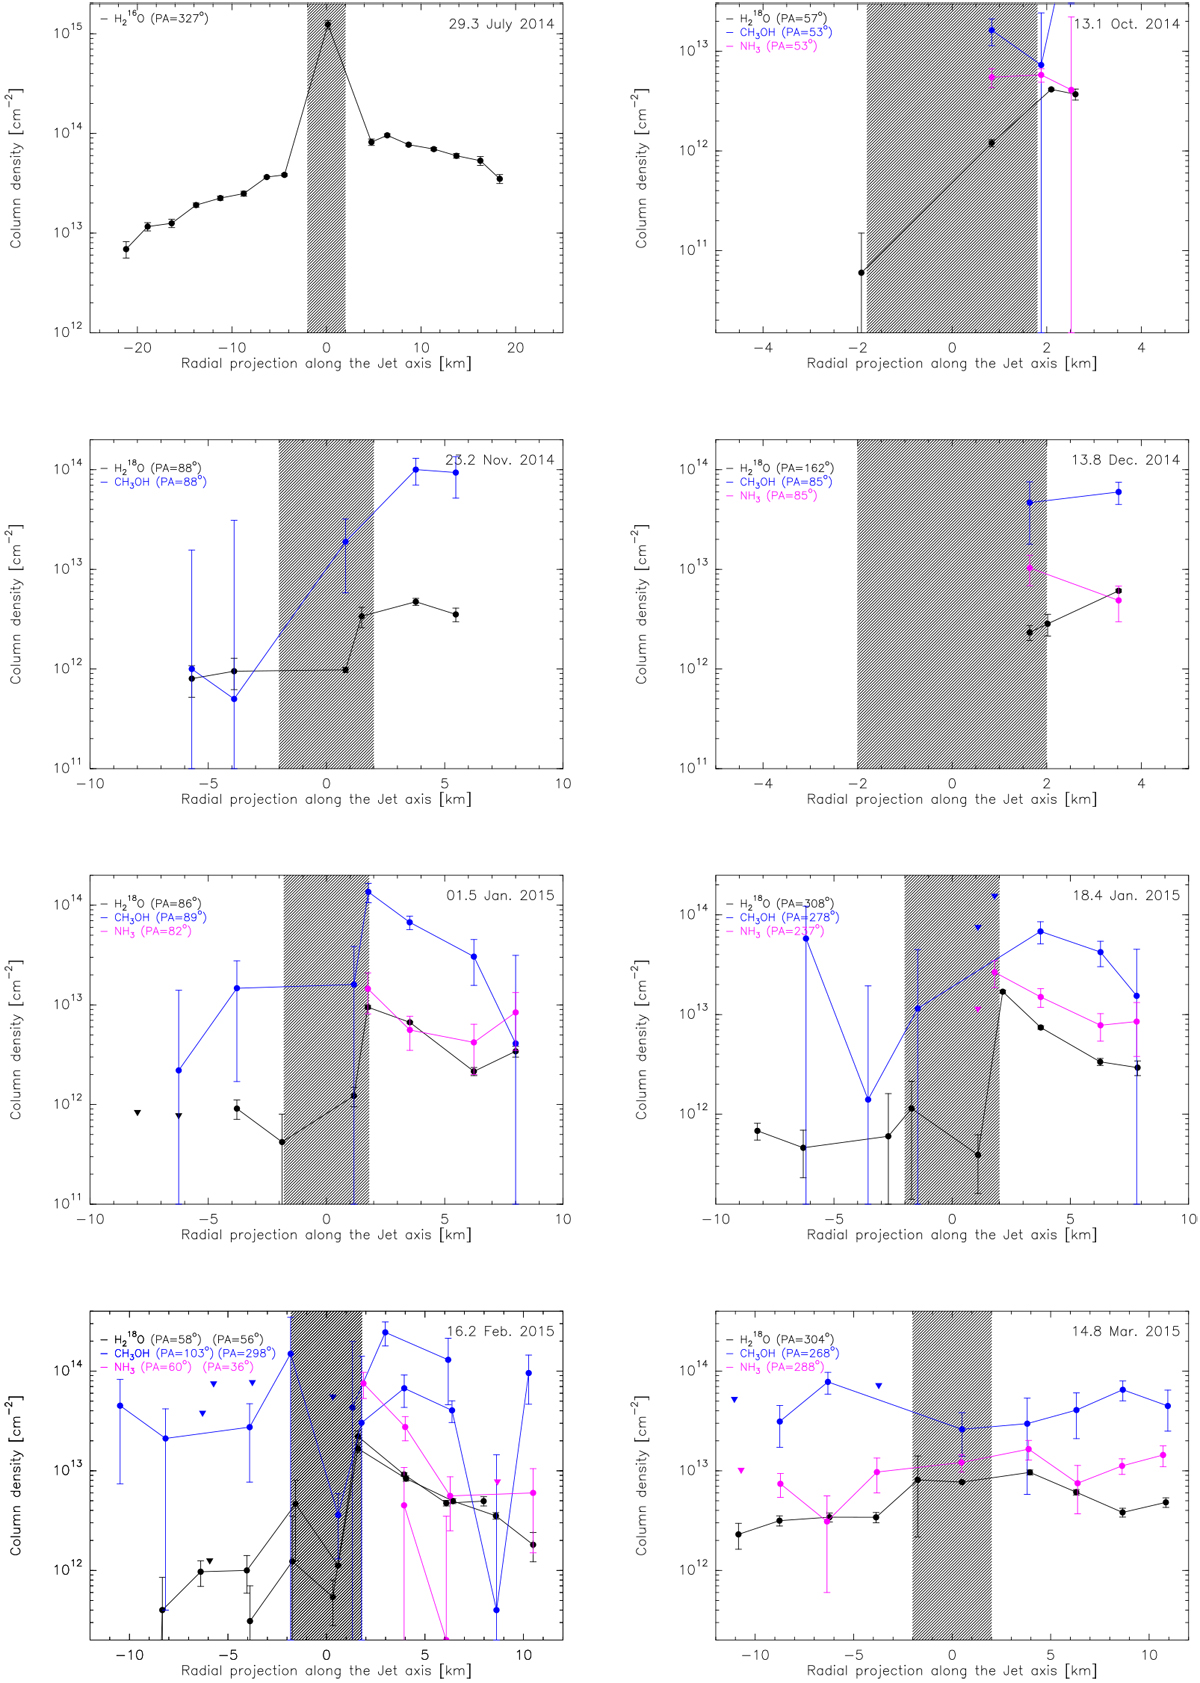
O or H![]() O, CH3OH, NH3, and CO column densities in the coma derived by the MIRO instrument from the maps (date indicated in each plot). Each measurement is derived from the average line intensity from points within 2.5 km projected distance from the nucleus and 60° in position angle (PA) over the sky along the comet jet axis. The mean jet PA is provided in the upper left corner for each molecule. The horizontal axis is the projected distance from the nucleus on the jet (Sun) side for positive values. The vertical scale is the derived column density in cm−2. The hatched region corresponds to pointing against the nucleus (line in absorption).
O, CH3OH, NH3, and CO column densities in the coma derived by the MIRO instrument from the maps (date indicated in each plot). Each measurement is derived from the average line intensity from points within 2.5 km projected distance from the nucleus and 60° in position angle (PA) over the sky along the comet jet axis. The mean jet PA is provided in the upper left corner for each molecule. The horizontal axis is the projected distance from the nucleus on the jet (Sun) side for positive values. The vertical scale is the derived column density in cm−2. The hatched region corresponds to pointing against the nucleus (line in absorption).
Current usage metrics show cumulative count of Article Views (full-text article views including HTML views, PDF and ePub downloads, according to the available data) and Abstracts Views on Vision4Press platform.
Data correspond to usage on the plateform after 2015. The current usage metrics is available 48-96 hours after online publication and is updated daily on week days.
Initial download of the metrics may take a while.