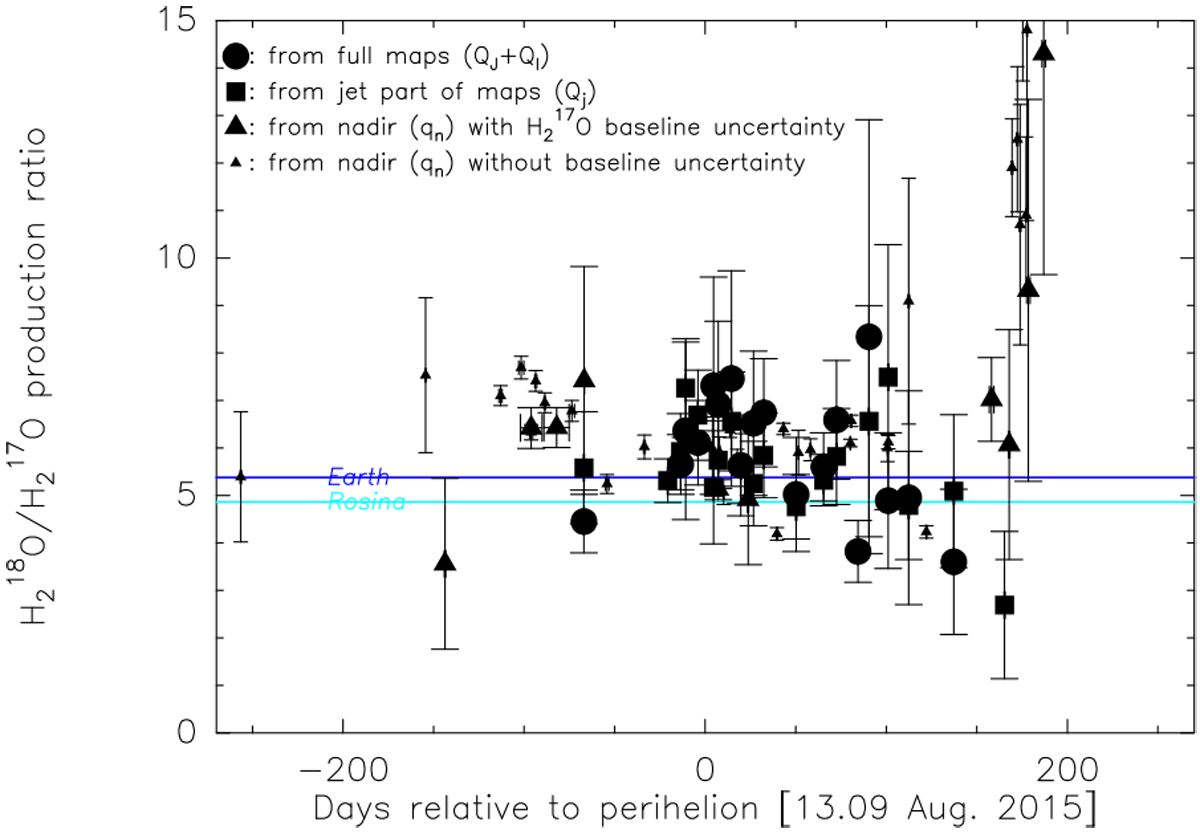
Fig. 19
Production rates ratio of H![]() O to H
O to H![]() O as a function of time. The dots refer to total production rates based on maps. Squares refer only to the ratio of production rates in the jet, which have smaller error bars (data from Tables A.3 and A.4). Triangles refer to nadir measurements of the production rate per unit solid angle, including uncertainties due to the H
O as a function of time. The dots refer to total production rates based on maps. Squares refer only to the ratio of production rates in the jet, which have smaller error bars (data from Tables A.3 and A.4). Triangles refer to nadir measurements of the production rate per unit solid angle, including uncertainties due to the H![]() O baseline when specified (larger symbols). The Earth (VSMOW) value and the value derived from the ROSINA experiment (Altwegg et al. 2015) are shown for comparison.
O baseline when specified (larger symbols). The Earth (VSMOW) value and the value derived from the ROSINA experiment (Altwegg et al. 2015) are shown for comparison.
Current usage metrics show cumulative count of Article Views (full-text article views including HTML views, PDF and ePub downloads, according to the available data) and Abstracts Views on Vision4Press platform.
Data correspond to usage on the plateform after 2015. The current usage metrics is available 48-96 hours after online publication and is updated daily on week days.
Initial download of the metrics may take a while.