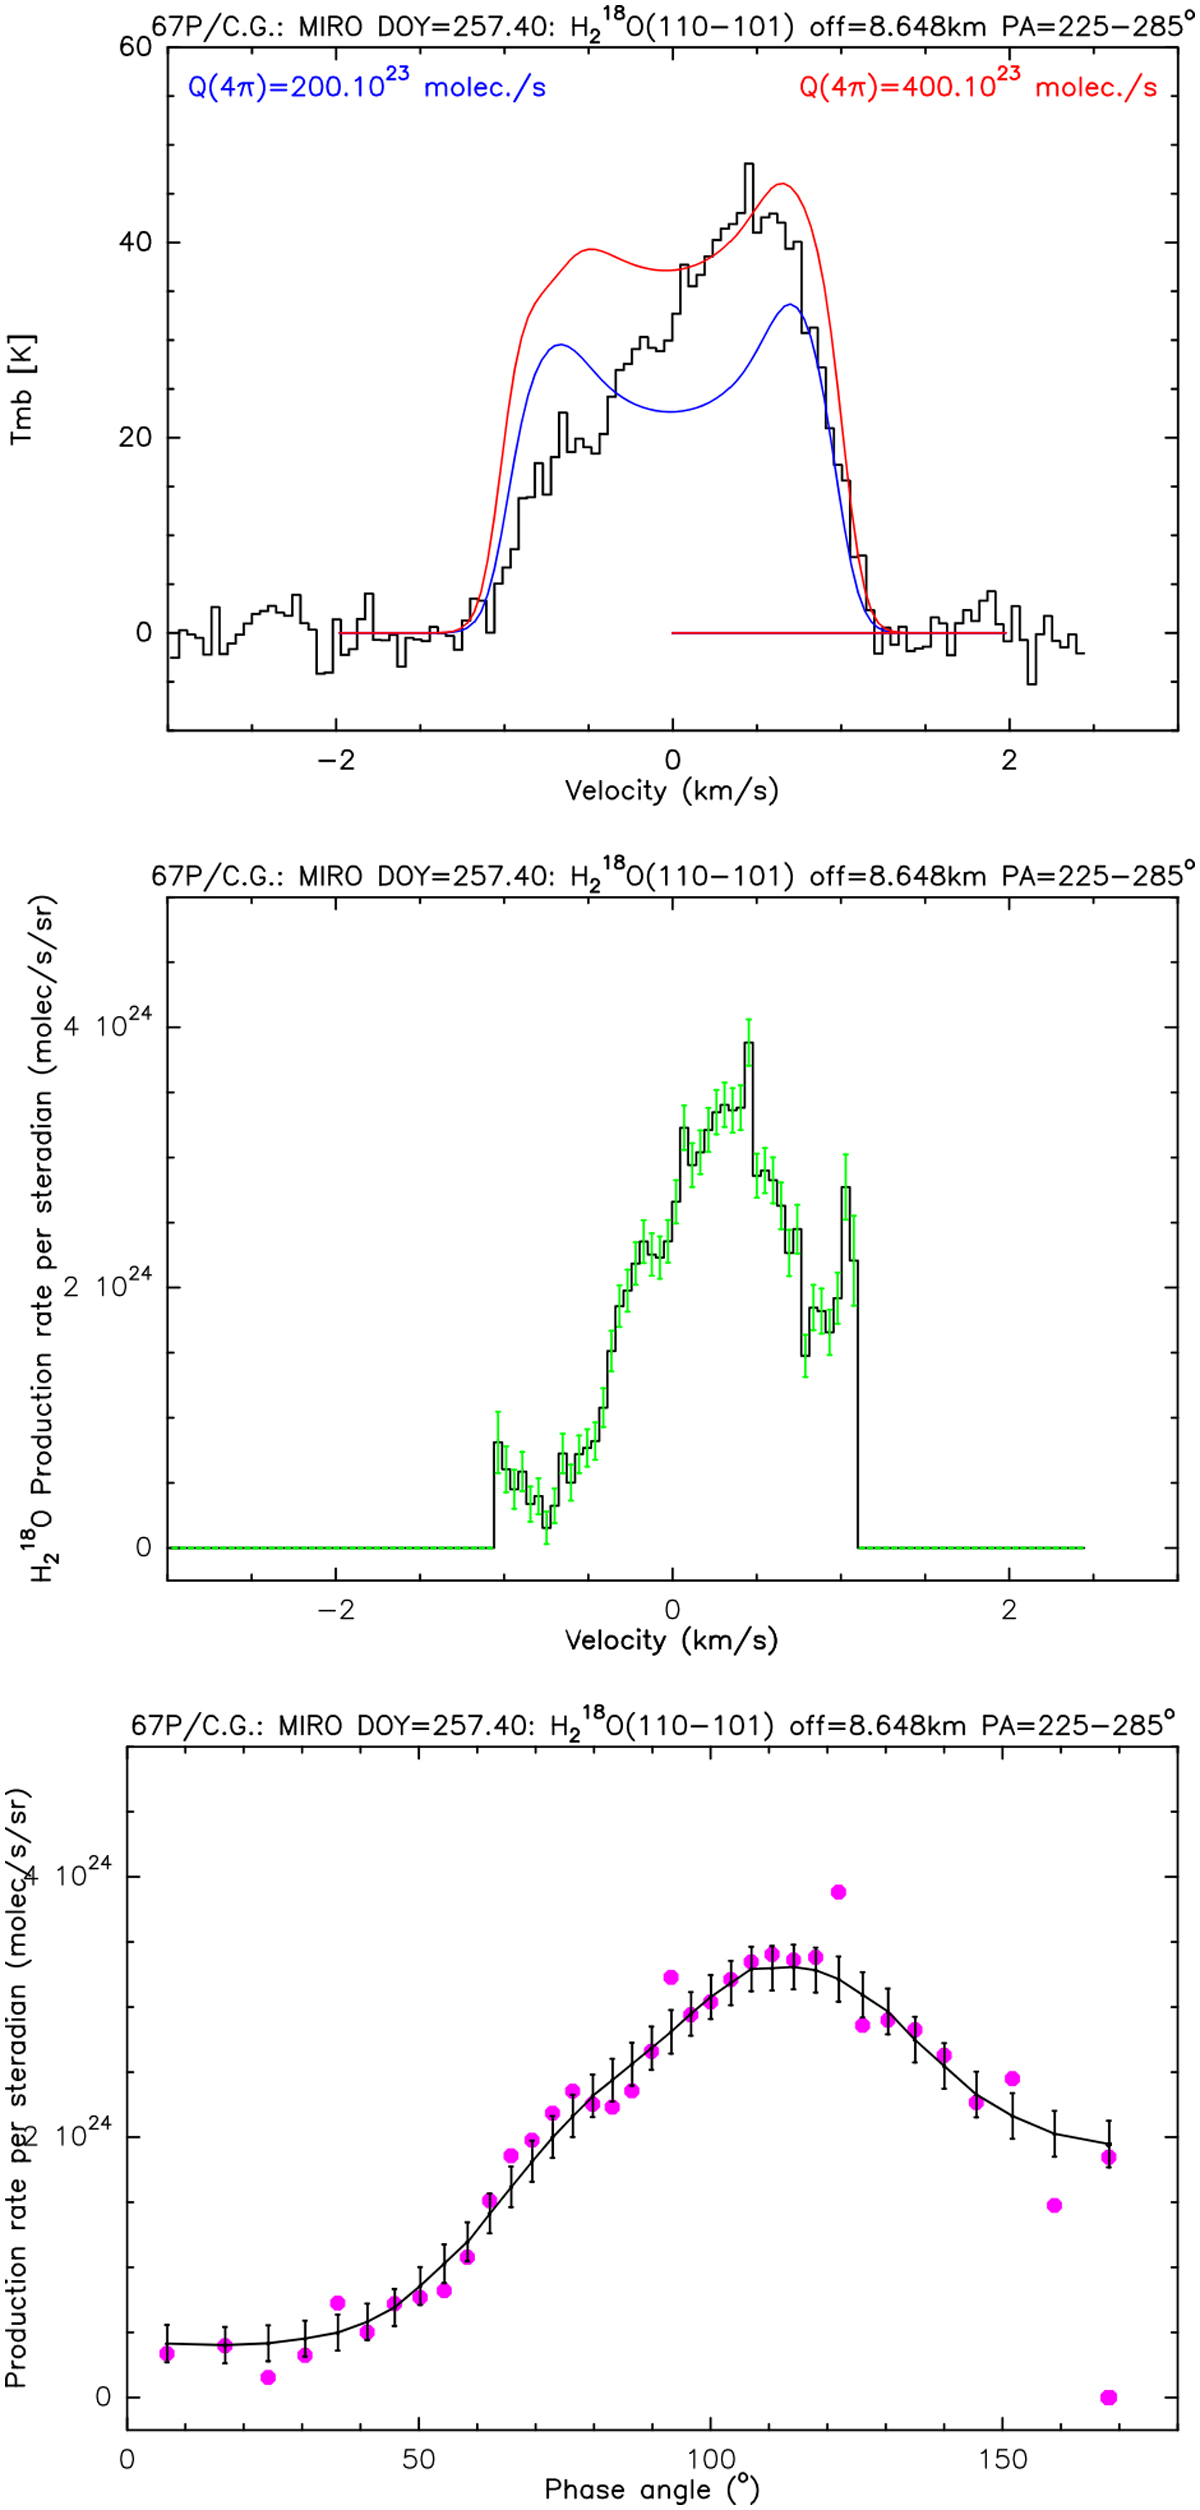
Fig. 10

Illustration of step 5 of data analysis for the jet. Top panel: extracted spectra of H![]() O from the 14.31–14.44 September 2015 UT map in the [225–285]° range of PA and [7.5–10] km range of the projected radius (mean radius of 8.648 km, middle spectrum from Fig. 9). Isotropic models with QH218O = 2 × 1025 molec. s−1
(blue) and QH218O = 4 × 1025 molec. s−1
(red) are superimposed for channel-by-channel interpolation and determination of
qH218O
for each channel. Central panel: line intensity in each channel or velocity bin converted into production rate per solid angle (vertical scale). There is a sharp cutoff for absolute velocities that are higher than the expansion velocity, for which the signal is close to 0, as expected. Bottom panel: horizontal scale in Doppler velocity converted into colatitude
ϕ
angle (vi = vexp cos(ϕi)) assuming a constant expansion velocity (vexp
= 0.82 km s−1 here). Pink dots show values that were retrieved from individual channels, and connected points represent a smoothed profile that takes thermal broadening into account (see text).
O from the 14.31–14.44 September 2015 UT map in the [225–285]° range of PA and [7.5–10] km range of the projected radius (mean radius of 8.648 km, middle spectrum from Fig. 9). Isotropic models with QH218O = 2 × 1025 molec. s−1
(blue) and QH218O = 4 × 1025 molec. s−1
(red) are superimposed for channel-by-channel interpolation and determination of
qH218O
for each channel. Central panel: line intensity in each channel or velocity bin converted into production rate per solid angle (vertical scale). There is a sharp cutoff for absolute velocities that are higher than the expansion velocity, for which the signal is close to 0, as expected. Bottom panel: horizontal scale in Doppler velocity converted into colatitude
ϕ
angle (vi = vexp cos(ϕi)) assuming a constant expansion velocity (vexp
= 0.82 km s−1 here). Pink dots show values that were retrieved from individual channels, and connected points represent a smoothed profile that takes thermal broadening into account (see text).
Current usage metrics show cumulative count of Article Views (full-text article views including HTML views, PDF and ePub downloads, according to the available data) and Abstracts Views on Vision4Press platform.
Data correspond to usage on the plateform after 2015. The current usage metrics is available 48-96 hours after online publication and is updated daily on week days.
Initial download of the metrics may take a while.


