Fig. C.1
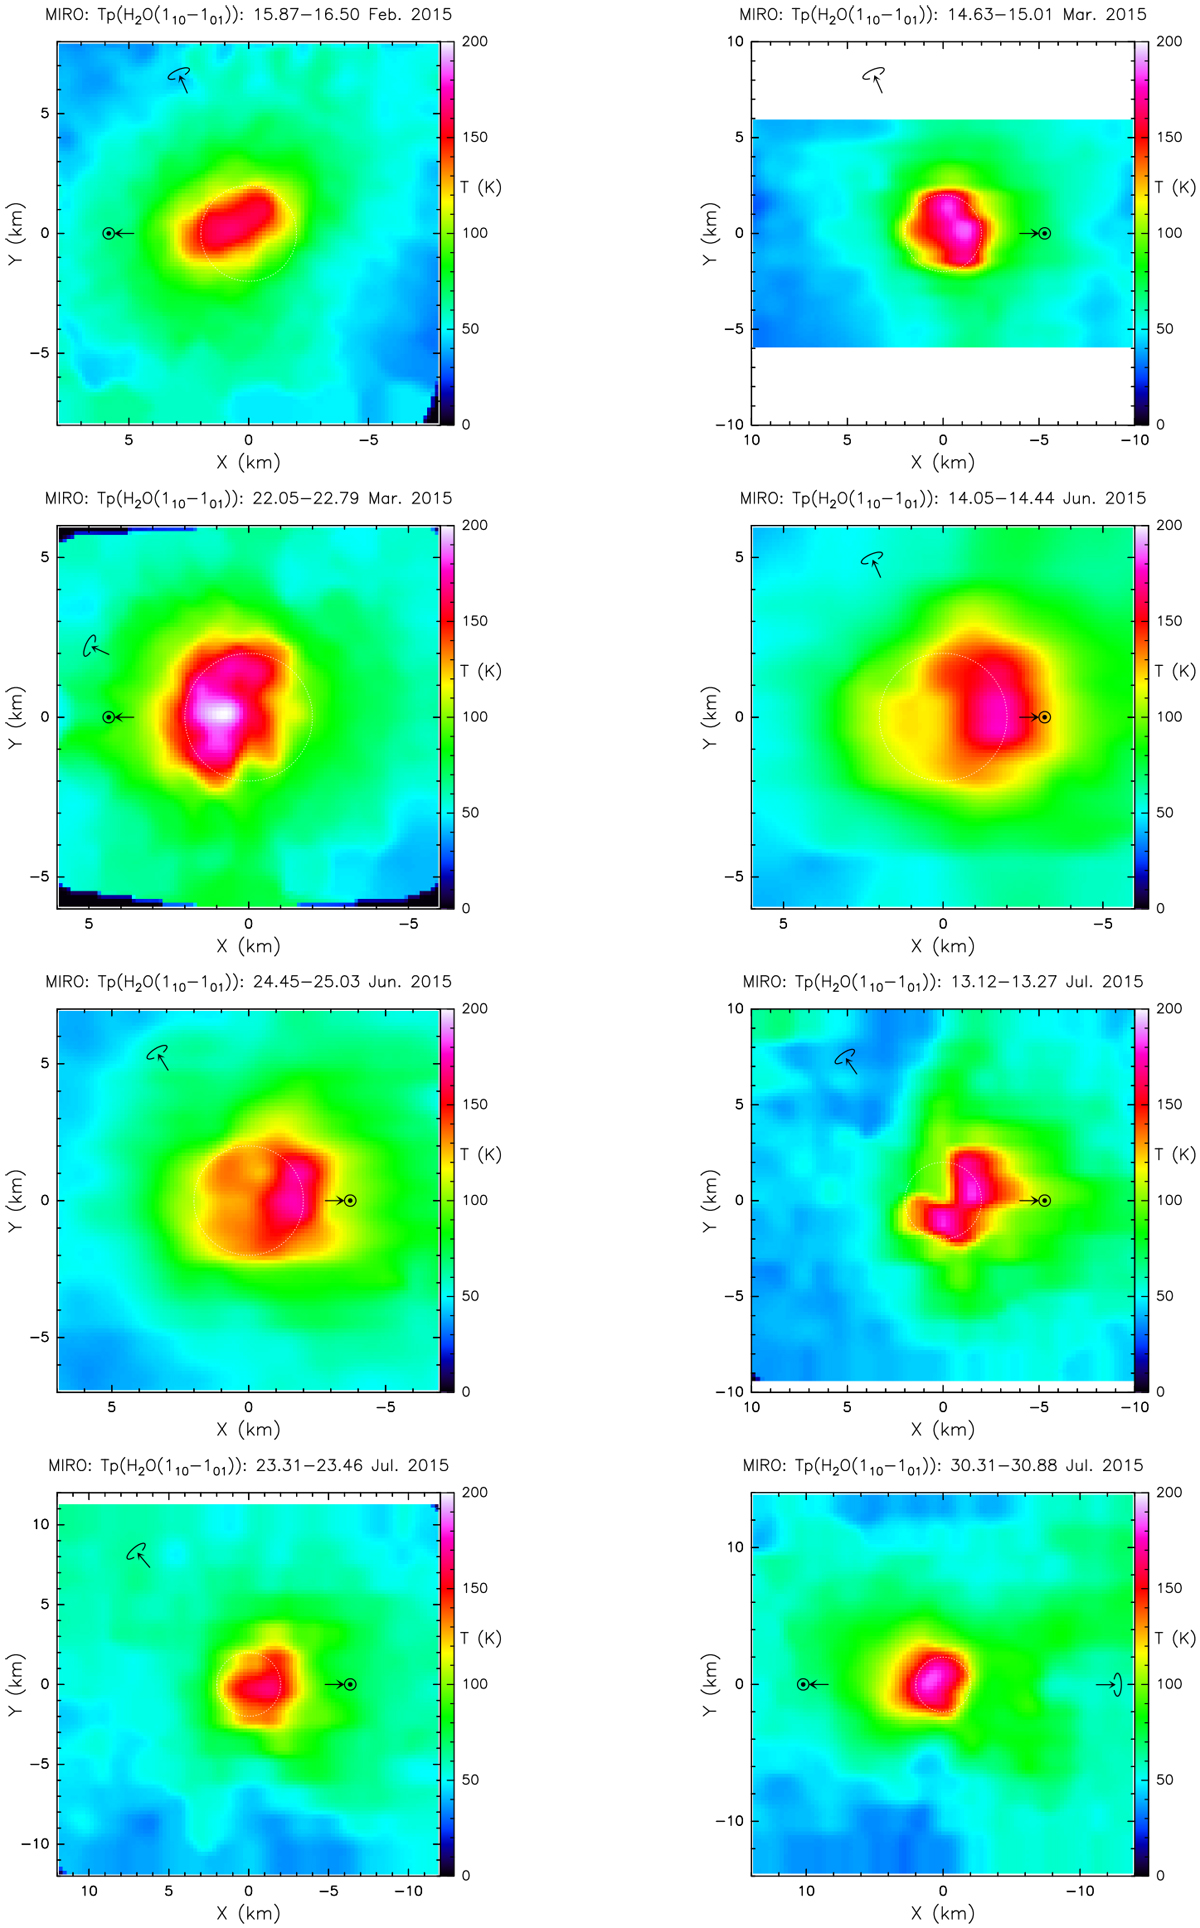
Sample of the interpolated maps of the peak intensity of the H![]() O line, which is a proxy (when saturated) for the gas temperature (−10 K because of the difference between the blackbody temperature and the Rayleigh-Jeans approximation used for the
Tmb scale). The 20 June 2016 map shown here was not used because the H
O line, which is a proxy (when saturated) for the gas temperature (−10 K because of the difference between the blackbody temperature and the Rayleigh-Jeans approximation used for the
Tmb scale). The 20 June 2016 map shown here was not used because the H![]() O line is no longer saturated at the local gas temperature: Tp(H
O line is no longer saturated at the local gas temperature: Tp(H![]() O) decreases out to ≈0 K because of the low column density.
O) decreases out to ≈0 K because of the low column density.
Current usage metrics show cumulative count of Article Views (full-text article views including HTML views, PDF and ePub downloads, according to the available data) and Abstracts Views on Vision4Press platform.
Data correspond to usage on the plateform after 2015. The current usage metrics is available 48-96 hours after online publication and is updated daily on week days.
Initial download of the metrics may take a while.