Fig. 9
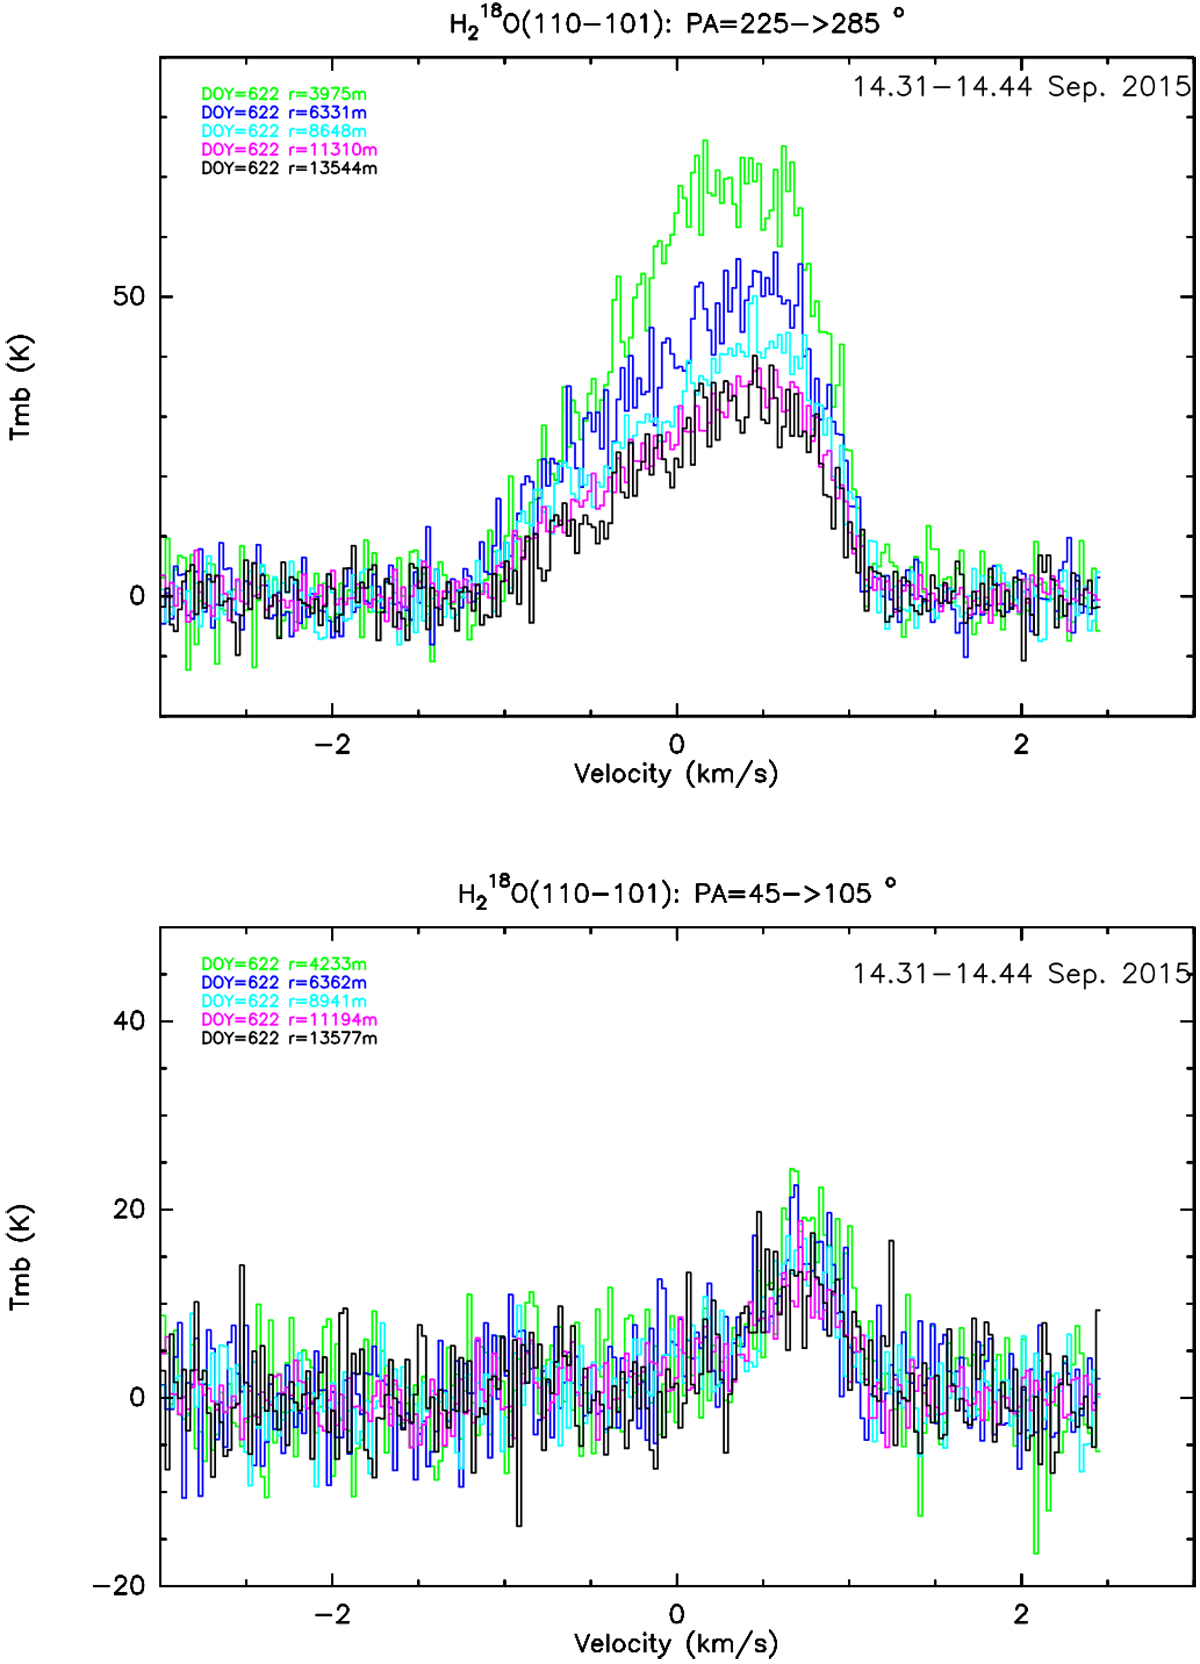
Illustration of step 4 of data analysis. Top panel: jet. Extracted spectra of H![]() O from the 14.31–14.44 September 2015 UT map: averaged spectra in the [225 − 285]° range of PA and bystep of ≈2.5 km in projected radius. The horizontal scale is Doppler velocity relative to the nucleus and the vertical scale line intensity in
Tmb scale. Bottom panel: night side. Same as above, but for the [45–105]° range of PA.
O from the 14.31–14.44 September 2015 UT map: averaged spectra in the [225 − 285]° range of PA and bystep of ≈2.5 km in projected radius. The horizontal scale is Doppler velocity relative to the nucleus and the vertical scale line intensity in
Tmb scale. Bottom panel: night side. Same as above, but for the [45–105]° range of PA.
Current usage metrics show cumulative count of Article Views (full-text article views including HTML views, PDF and ePub downloads, according to the available data) and Abstracts Views on Vision4Press platform.
Data correspond to usage on the plateform after 2015. The current usage metrics is available 48-96 hours after online publication and is updated daily on week days.
Initial download of the metrics may take a while.