Fig. 7
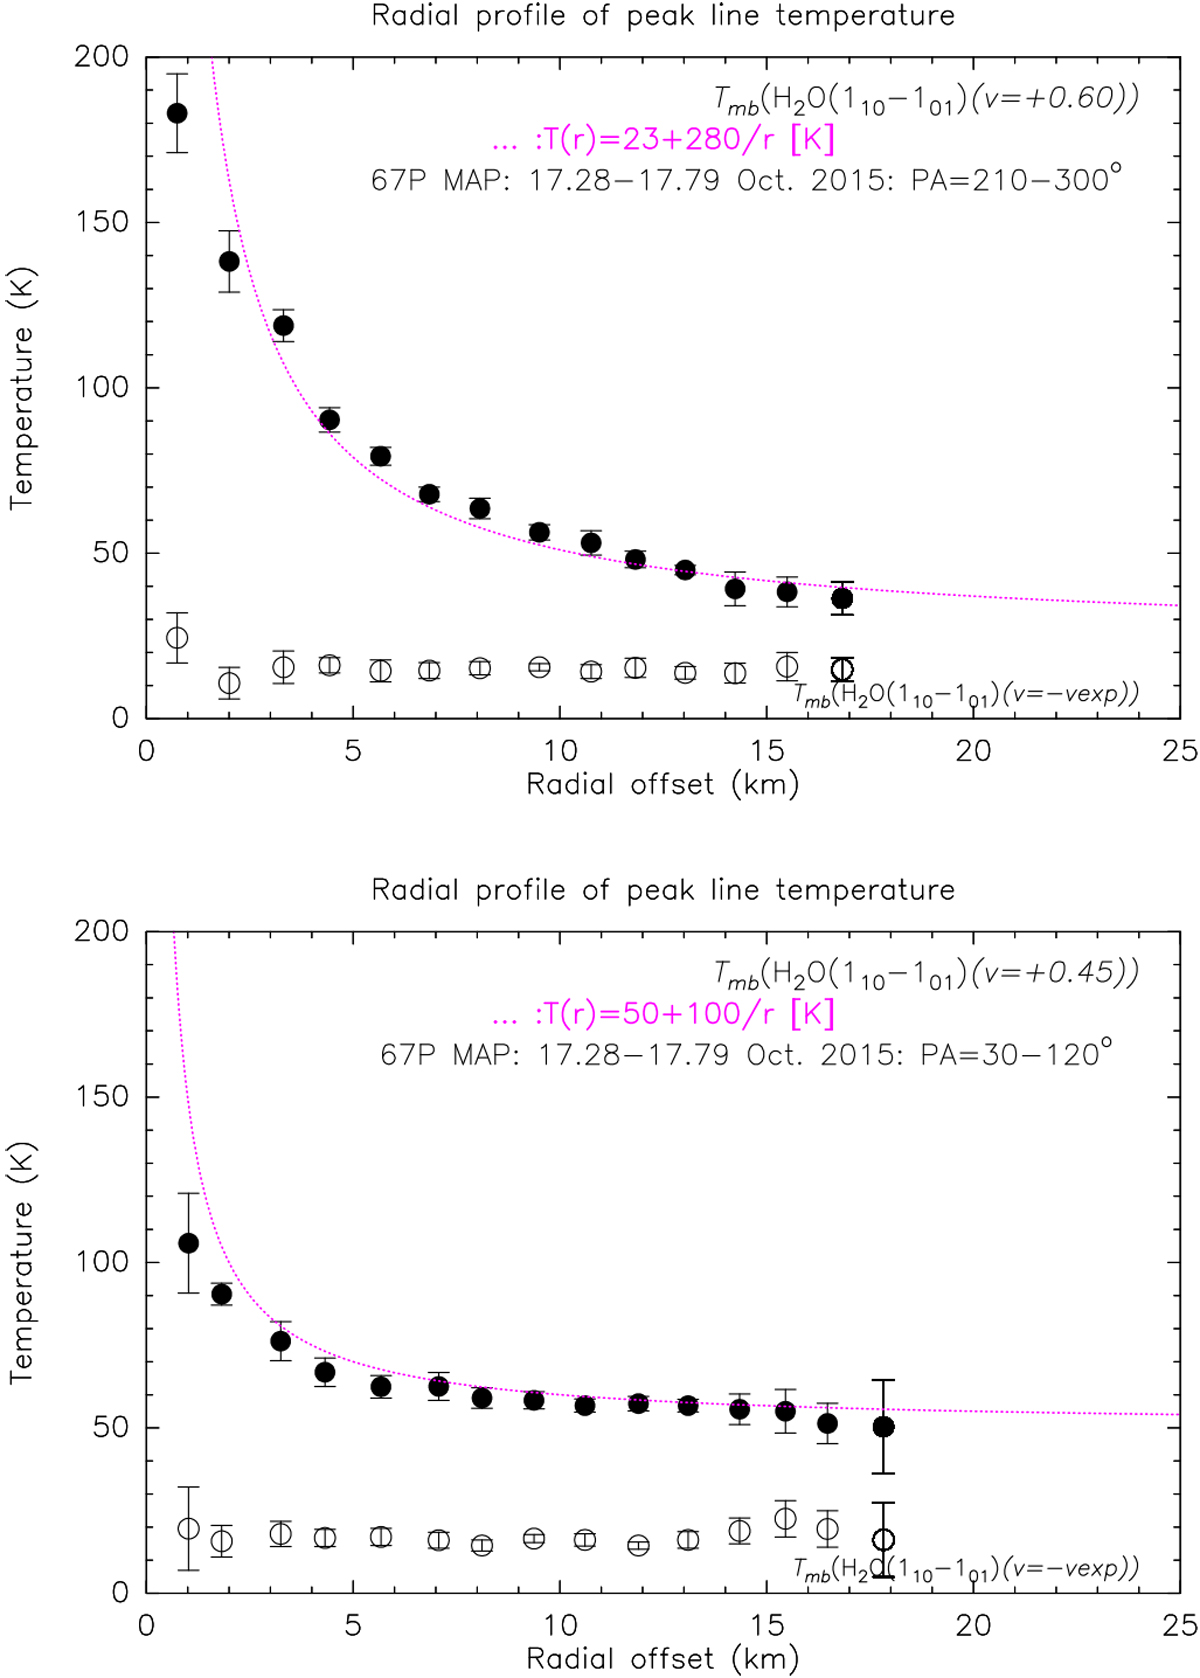
Top panel: example of a radial profile of the peak intensity Tmb
of the saturated H![]() O line at channel vi ~ +0.6 km s−1
as a functionof projected distance ρ
from the nucleus in the jet (full circles). The empty circles correspond to the
Tmb value for channels at vi ~−vexp, which saturate close to the gas temperature at the distance of the spacecraft. The dotted line shows the adopted gas temperature profile (see text). Bottom panel: same as above for the direction opposite to the jet direction (i.e., night side), using here channels at +0.45 km s−1. Higher values a few kilometers from the nucleus can be interpreted as due to a lower efficiency of the cooling of the gas through adiabatic expansion.
O line at channel vi ~ +0.6 km s−1
as a functionof projected distance ρ
from the nucleus in the jet (full circles). The empty circles correspond to the
Tmb value for channels at vi ~−vexp, which saturate close to the gas temperature at the distance of the spacecraft. The dotted line shows the adopted gas temperature profile (see text). Bottom panel: same as above for the direction opposite to the jet direction (i.e., night side), using here channels at +0.45 km s−1. Higher values a few kilometers from the nucleus can be interpreted as due to a lower efficiency of the cooling of the gas through adiabatic expansion.
Current usage metrics show cumulative count of Article Views (full-text article views including HTML views, PDF and ePub downloads, according to the available data) and Abstracts Views on Vision4Press platform.
Data correspond to usage on the plateform after 2015. The current usage metrics is available 48-96 hours after online publication and is updated daily on week days.
Initial download of the metrics may take a while.