Fig. 3
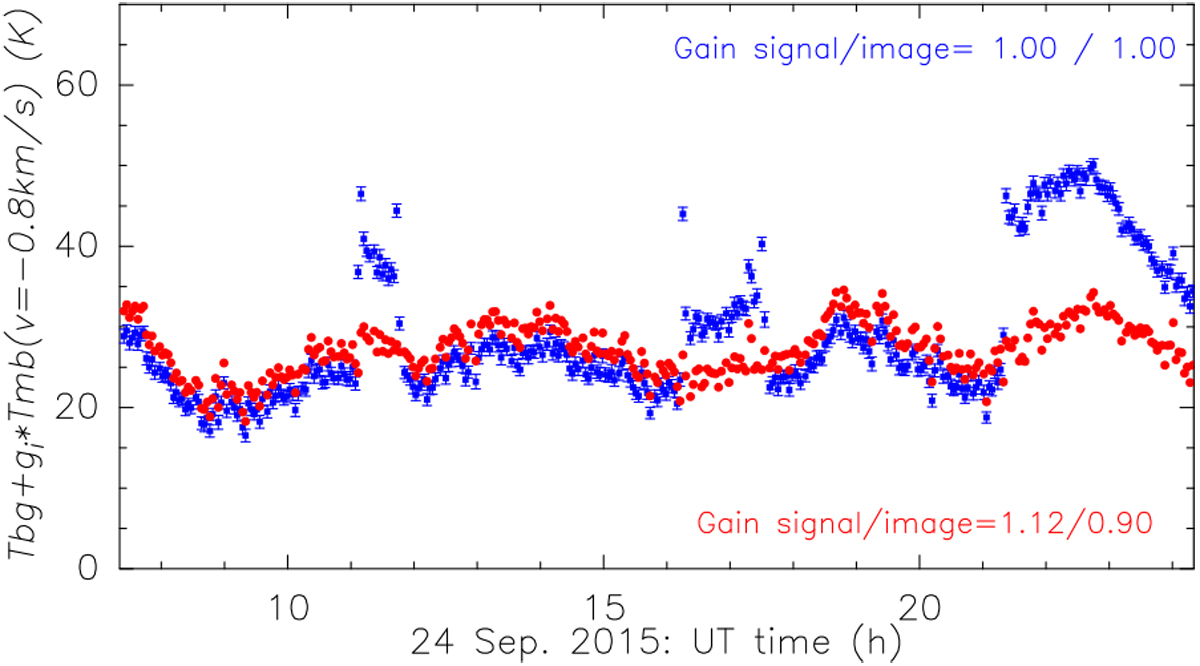
Intensity measured at − 0.8 km s−1 on saturated H![]() O spectra obtained on 24 September 2015 between 7.5 and 24 h UT while scanning across the nucleus (see the spectrum examples in Fig. 2). The blue and red dots show the value before and after gain correction, respectively. The jumps before correction correspond to times when MIRO pointed on the nucleus. Error bars are only plotted for the uncorrected data.
O spectra obtained on 24 September 2015 between 7.5 and 24 h UT while scanning across the nucleus (see the spectrum examples in Fig. 2). The blue and red dots show the value before and after gain correction, respectively. The jumps before correction correspond to times when MIRO pointed on the nucleus. Error bars are only plotted for the uncorrected data.
Current usage metrics show cumulative count of Article Views (full-text article views including HTML views, PDF and ePub downloads, according to the available data) and Abstracts Views on Vision4Press platform.
Data correspond to usage on the plateform after 2015. The current usage metrics is available 48-96 hours after online publication and is updated daily on week days.
Initial download of the metrics may take a while.