Fig. 5
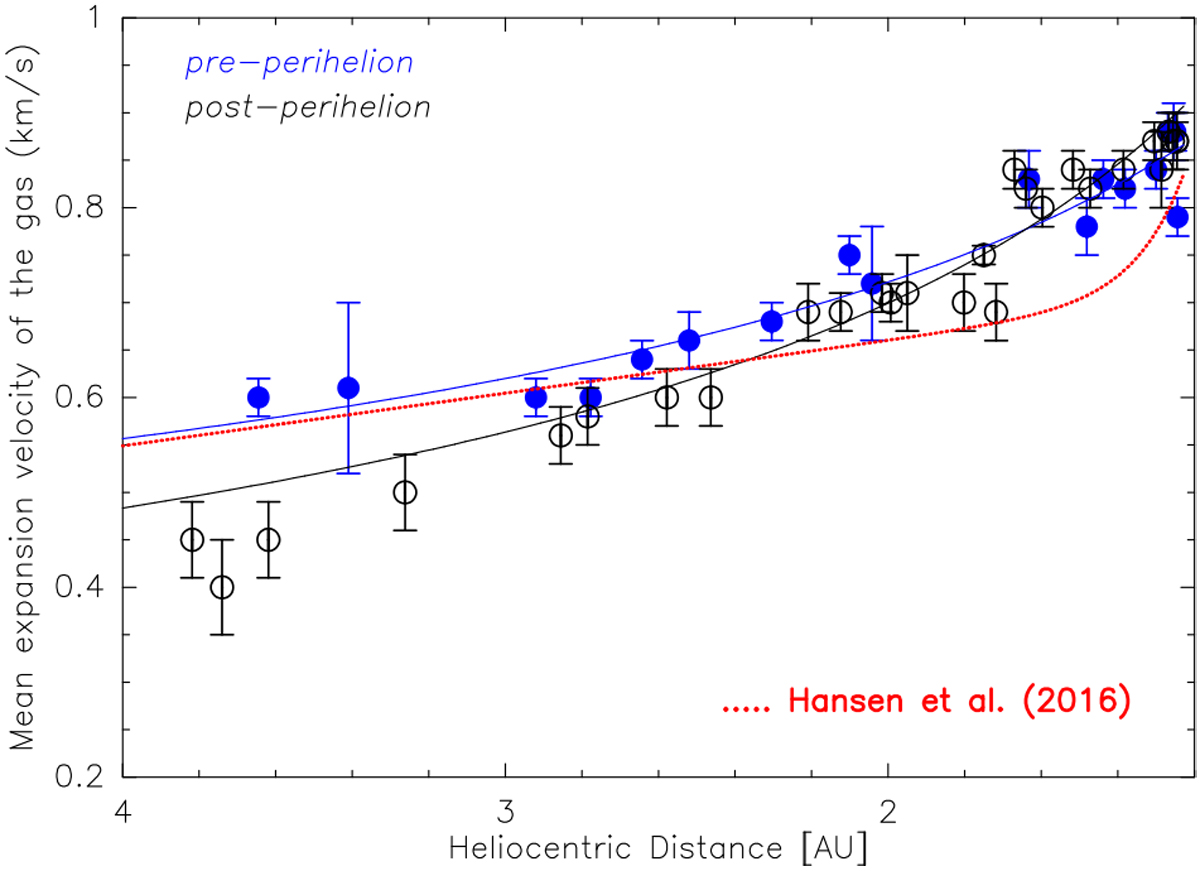
Mean gas expansion velocity measured for the jet as given in Table A.2. These values were used to invert the lines profiles and compute production rates for all molecules. Filled blue dots show pre-perihelion data and empty black symbols represent post-perihelion observations. The fitted power laws are
![]() km s−1
pre-perihelion and
km s−1
pre-perihelion and ![]() km s−1
post-perihelion, with uncertainties of 0.01 km s−1
and 0.03 on the power-law index. For comparison we plot the adopted (water) expansion velocity profile of Hansen et al. (2016) as a red dotted line.
km s−1
post-perihelion, with uncertainties of 0.01 km s−1
and 0.03 on the power-law index. For comparison we plot the adopted (water) expansion velocity profile of Hansen et al. (2016) as a red dotted line.
Current usage metrics show cumulative count of Article Views (full-text article views including HTML views, PDF and ePub downloads, according to the available data) and Abstracts Views on Vision4Press platform.
Data correspond to usage on the plateform after 2015. The current usage metrics is available 48-96 hours after online publication and is updated daily on week days.
Initial download of the metrics may take a while.