Fig. 1
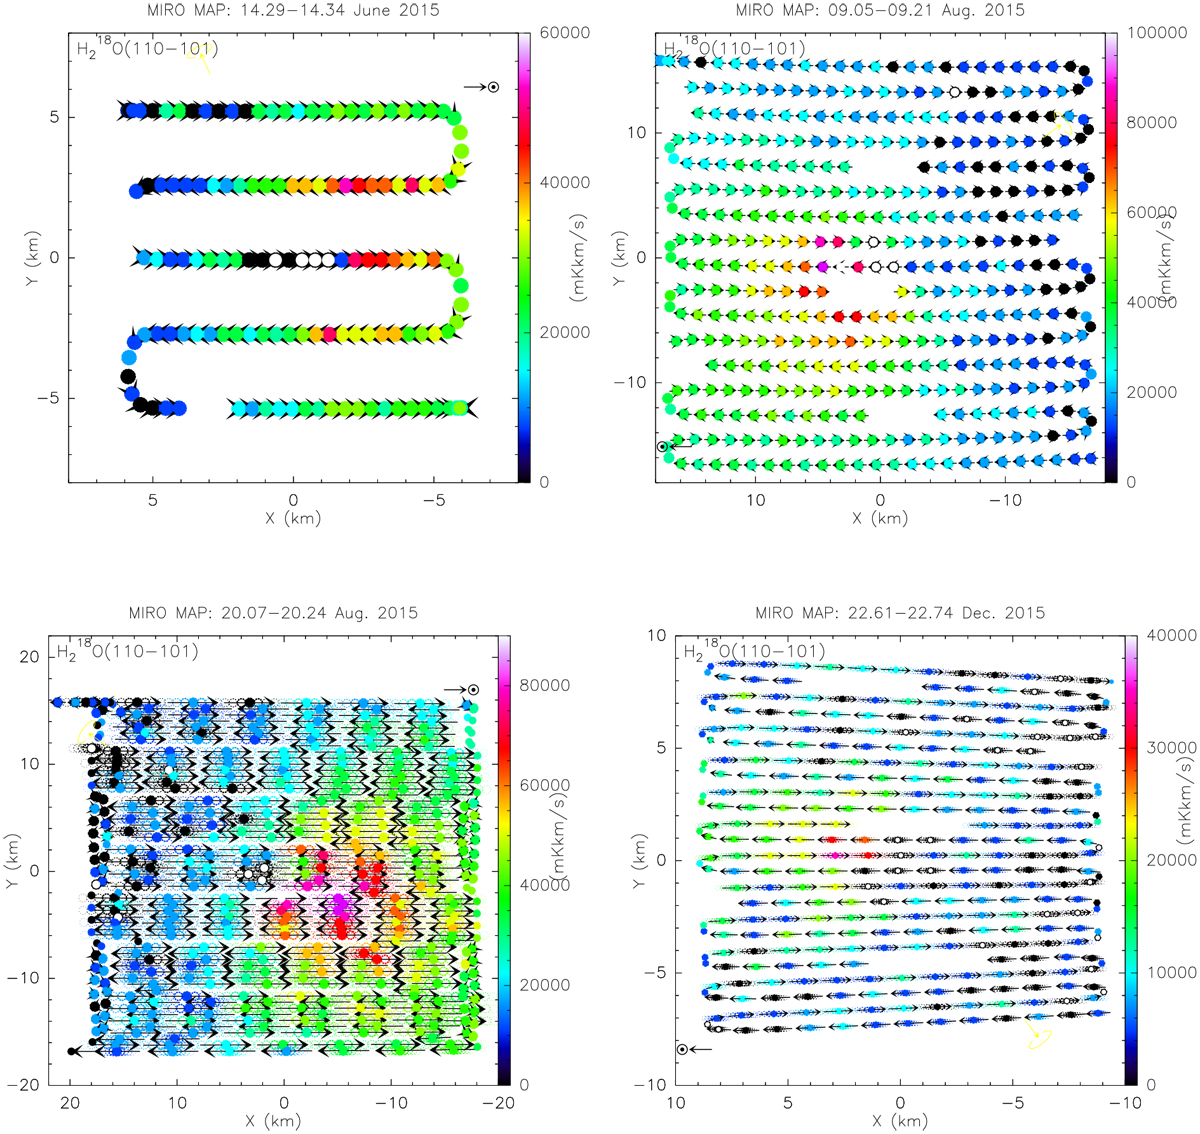
Examples of schemes used to scan the coma of 67P with Rosetta/MIRO. Each circle has the projected size of the MIRO beam width (7.5′) at the distance of the comet and is projected at the pointed position at the center of the 30 s integration. The scales of the
X- and Y -axes are the distance from comet center. Arrows show the scanning direction and its motion during 30 s. The color provides the H![]() O integrated line intensity according to the scale given on the right. The Sun-projected direction is indicated. Blanks along the sampling correspond to data gaps during calibration (once every 30 min).
O integrated line intensity according to the scale given on the right. The Sun-projected direction is indicated. Blanks along the sampling correspond to data gaps during calibration (once every 30 min).
Current usage metrics show cumulative count of Article Views (full-text article views including HTML views, PDF and ePub downloads, according to the available data) and Abstracts Views on Vision4Press platform.
Data correspond to usage on the plateform after 2015. The current usage metrics is available 48-96 hours after online publication and is updated daily on week days.
Initial download of the metrics may take a while.