Fig. 23
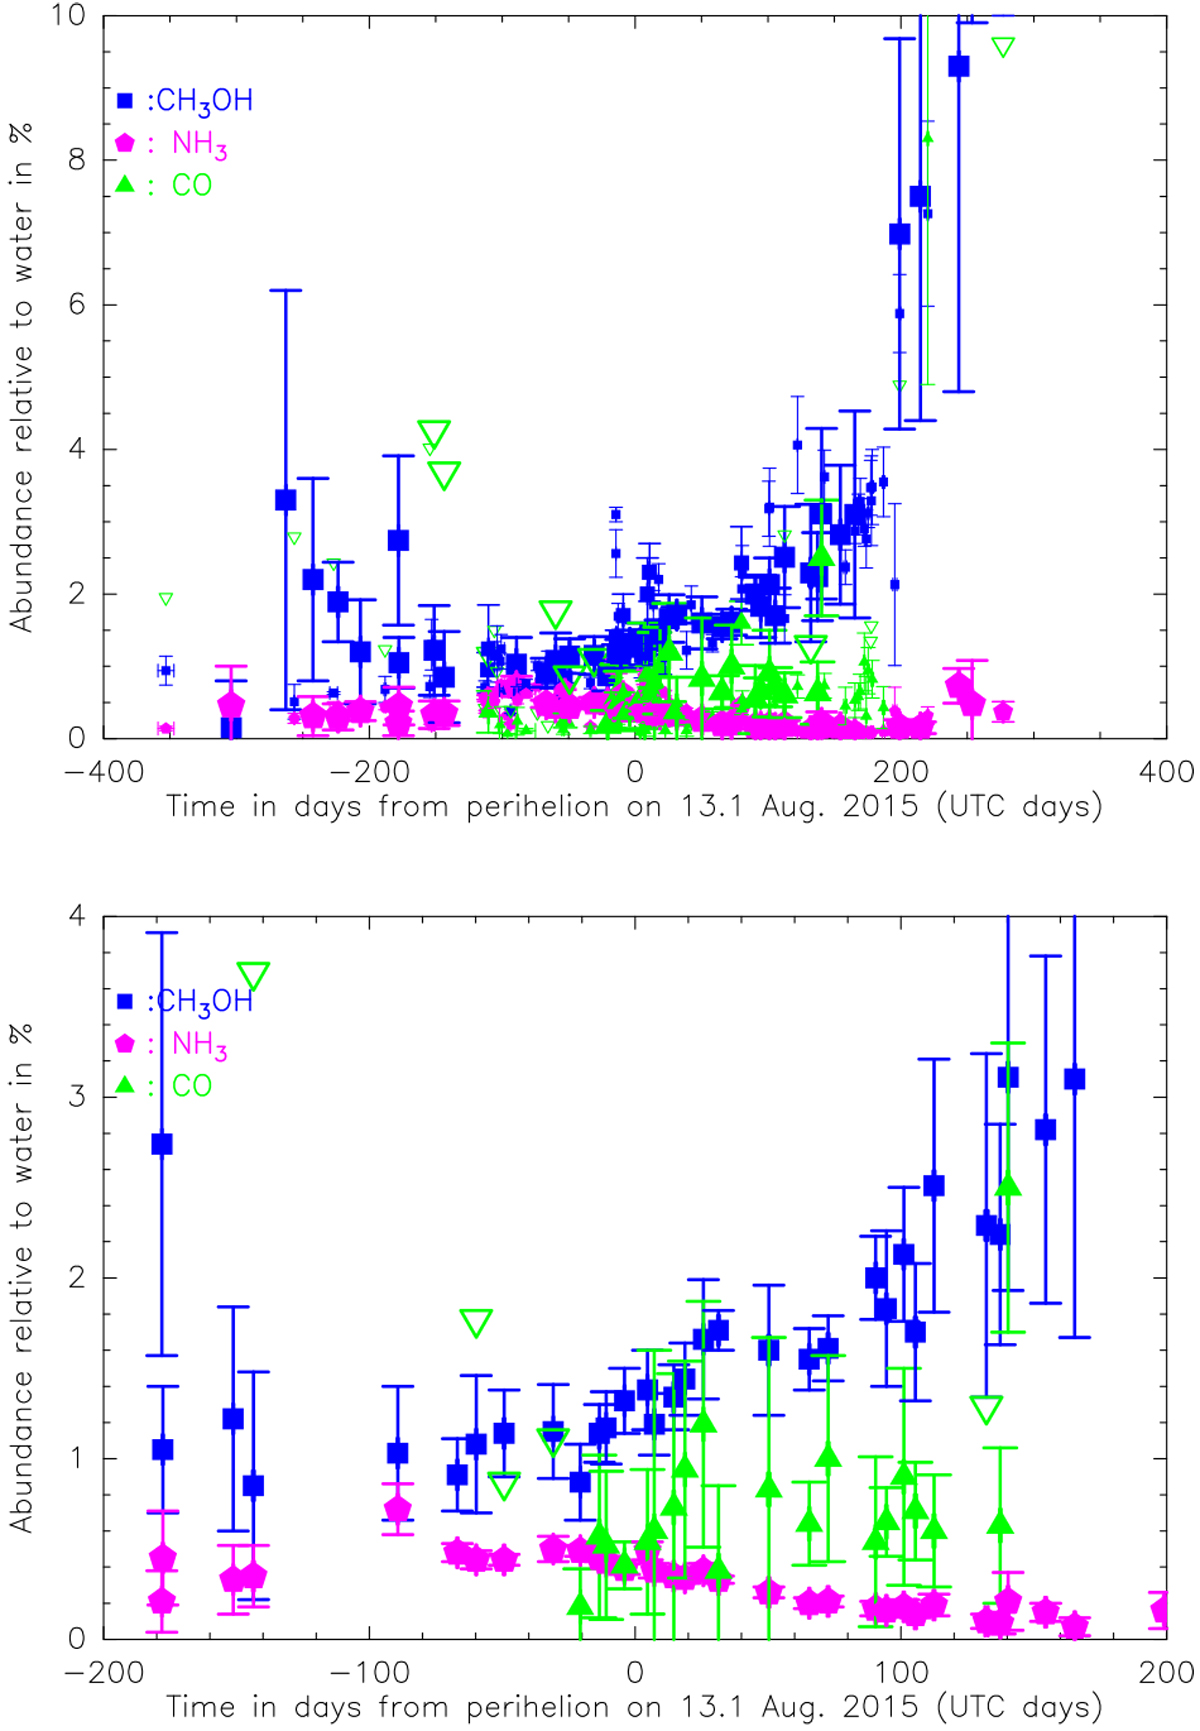
Evolution of the abundances relative to water of methanol, ammonia, and CO in the coma from July 2014 to September 2016. The larger symbols are based on the global outgassing rates derived from mapping data. Additional more local measurements from nadir or single lines of sight are shown by smaller symbols in the upper panel. Empty down-pointing triangles correspond to 3σ upper limits.Bottom panel: zoom over ± 200 days aroundperihelion.
Current usage metrics show cumulative count of Article Views (full-text article views including HTML views, PDF and ePub downloads, according to the available data) and Abstracts Views on Vision4Press platform.
Data correspond to usage on the plateform after 2015. The current usage metrics is available 48-96 hours after online publication and is updated daily on week days.
Initial download of the metrics may take a while.