Fig. 20
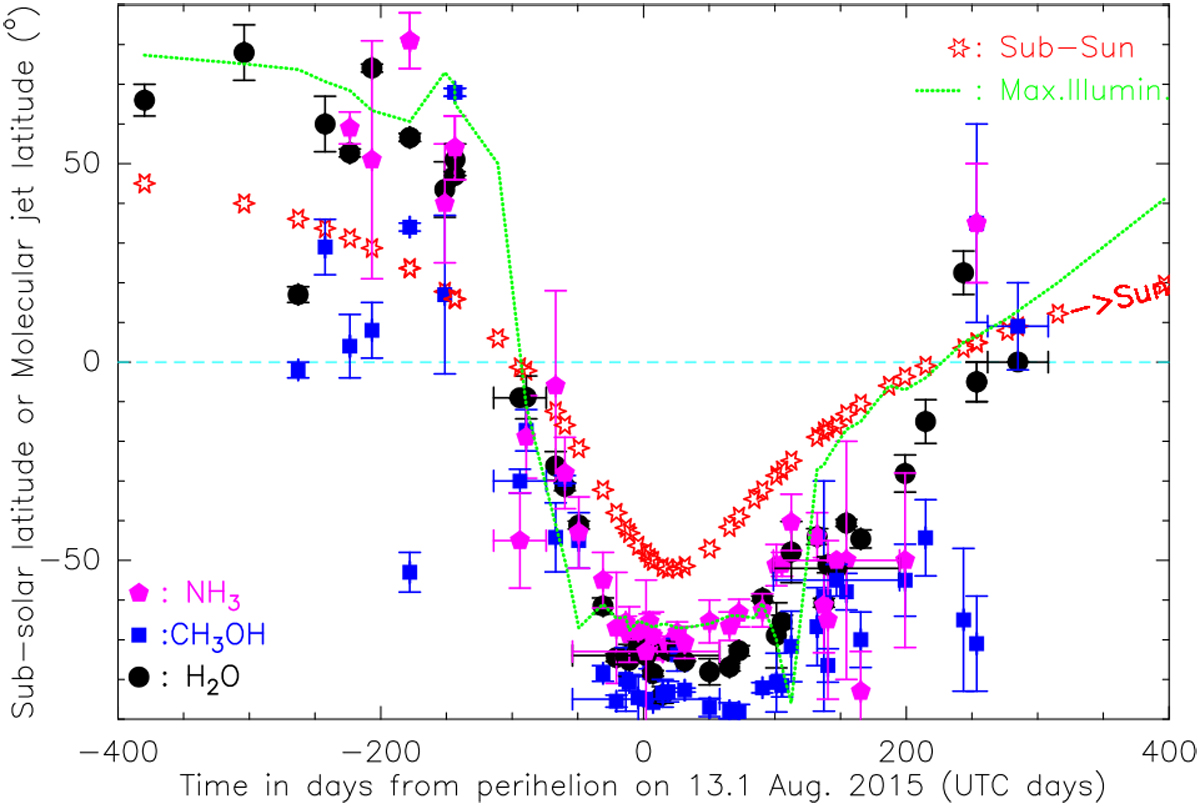
Evolution of the mean latitude of the bulk of outgassing (jet) water, methanol, and ammonia from July 2014 to September 2016. The red stars show the latitude of the subsolar point, which crosses the equator at the comet equinoxes, 95 days before perihelion and 220 days after. The green dotted line corresponds to the average latitude of the facets that receive the maximum solar flux.
Current usage metrics show cumulative count of Article Views (full-text article views including HTML views, PDF and ePub downloads, according to the available data) and Abstracts Views on Vision4Press platform.
Data correspond to usage on the plateform after 2015. The current usage metrics is available 48-96 hours after online publication and is updated daily on week days.
Initial download of the metrics may take a while.