Fig. E.1
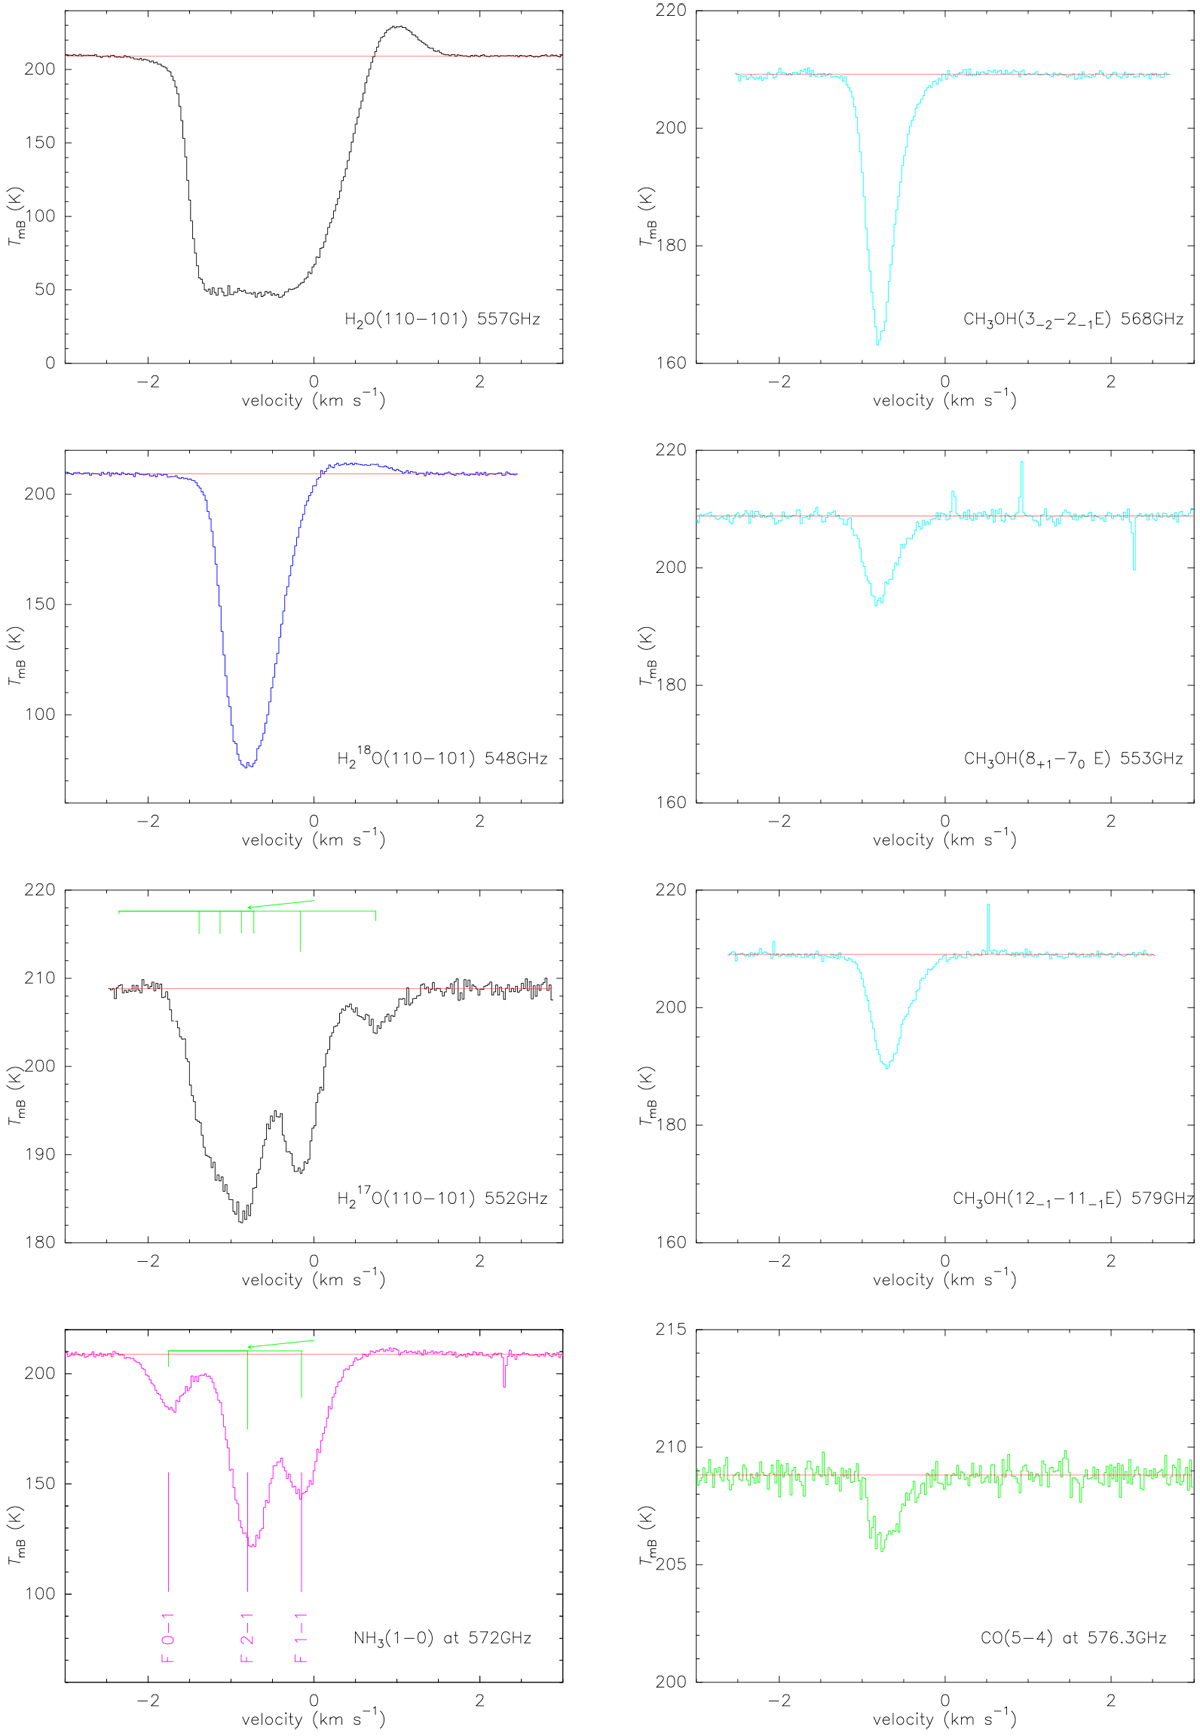
Nadir pointing spectra obtained between 30.51 and 31.00 August 2015. The vertical scale is main beam brightness temperature in K. The horizontal scale is Doppler velocity relative to the nucleus. Lines are seen in absorption against the nucleus background temperature at 209 K and are blueshifted by −0.8 km s−1
because most of the gas flows toward MIRO/Rosetta. The position and expected relative intensities of the hyperfine components of the H![]() O and NH3 lines are shown. They are displaced by −0.8 km s−1
, which is the mean gas bulk velocity as seen in other lines. Narrow spikes, which are instrument artifacts, appear regularly in the spectra of ammonia and two of the methanol lines.
O and NH3 lines are shown. They are displaced by −0.8 km s−1
, which is the mean gas bulk velocity as seen in other lines. Narrow spikes, which are instrument artifacts, appear regularly in the spectra of ammonia and two of the methanol lines.
Current usage metrics show cumulative count of Article Views (full-text article views including HTML views, PDF and ePub downloads, according to the available data) and Abstracts Views on Vision4Press platform.
Data correspond to usage on the plateform after 2015. The current usage metrics is available 48-96 hours after online publication and is updated daily on week days.
Initial download of the metrics may take a while.