| Issue |
A&A
Volume 616, August 2018
|
|
|---|---|---|
| Article Number | A20 | |
| Number of page(s) | 18 | |
| Section | Catalogs and data | |
| DOI | https://doi.org/10.1051/0004-6361/201832786 | |
| Published online | 07 August 2018 | |
A complete sample of LSP blazars fully described in γ-rays
New γ-ray detections and associations with Fermi-LAT
1
Science Data Center della Agencia Spaziale Italiana, SSDC - ASI,
Rome,
Italy
e-mail: bruno.arsioli@ssdc.asi.it
2
Instituto de Física Gleb Wataghin, UNICAMP,
R. Sérgio Buarque de Holanda 777,
13083-859
Campinas,
Brazil
e-mail: arsioli@ifgw.unicamp.br
3
ICRANet-Rio, CBPF,
Rua Dr. Xavier Sigaud 150,
22290-180
Rio de Janeiro,
Brazil
4
ASI - Agenzia Spaziale Italiana,
Via del Politecnico snc,
00133
Roma,
Italy
e-mail: gianluca.polenta@asi.it
Received:
7
February
2018
Accepted:
22
March
2018
Context. We study the γ-ray and broadband spectral energy distribution (SED) properties of a complete sample of 104 bright, radio-selected low-synchrotron peaked (LSP) blazars, which have well-characterized SEDs from radio to X-rays. Most of the sources have already been detected in the γ-ray band by Fermi-LAT, however almost 20% of these blazars have no counterpart in any of the Fermi catalogs published so far.
Aims. Using the Fermi Science Tools, we look for γ-ray emission for those objects not yet reported in any Fermi-LAT catalog, finding new detections and associations. We then study the multifrequency SED for all sources in our sample, fitting their synchrotron (Syn) and inverse Compton (IC) components. A complete sample of LSP blazars with a full description in γ-ray is unique. We use this sample to derive the distribution of the Compton dominance (CD) along with population properties such as Syn and IC peak power, and frequency distributions.
Methods. We performed a binned likelihood analysis in the 0.3–500 GeV energy band with Fermi-LAT Pass 8 data, integrating over 7.5 yr of observations. We studied γ-ray light curves and test statistic (TS) maps to validate new detections and associations, thereby building a better picture of the high-energy activity in radio-selected LSP blazars. We fit the IC component for the new detections using all data at our disposal from X-rays to GeV γ-rays, enhancing the amount of information available to study the Syn to IC peak-power correlations.
Results. We deliver a unique characterization in γ-rays for a complete sample of LSP blazars. We show that three previously unidentified 3FGL sources can be associated with blazars when using improved γ-ray positions obtained from TS maps. Six previously unreported γ-ray sources are detected at TS > 20 level, while another three show TS values between 10–20. We evaluate two cases in which source confusion is likely present. In four cases there is no significant γ-ray signature when integrating over 7.5 yr. Short-lived flares at ~1 month scale, however, have been detected in these sources. Finally, we measure the log(CD) for the sample, which has a Gaussian-like distribution with median log(CD) ≈ 0.1, implying that on average the peak-power for the Syn and IC components in LSP blazars is similar.
Key words: gamma rays: galaxies / galaxies: active
© ESO 2018
1 Introduction
Blazars are a particular class of jetted active galactic nuclei (AGN), corresponding to the very few cases where jets are pointing close to our line of sight (Padovani et al. 2017). These objects are known for having a rather unique spectral energy distribution (SED) often characterized by the presence of two nonthermal bumps in the log(νfν) versus log(ν) plane, which extends along the whole electromagnetic window from radio up to TeV γ-rays. Also known for their rapid and large amplitude spectral variability, usually the observed radiation shows extreme properties owing to the relativistic nature of the jets, which result in amplification effects. Blazars are relatively rare; there are ~4000 optically identified objects in the latest blazar surveys, 5BZcat (Massaro et al. 2015) and 2WHSP (Chang et al. 2017), and they have been extensively studied by means of a multifrequency approach.
According to the standard picture (e.g., Giommi et al. 2012a), the first peak in log(νfν) vs. log(ν) plane is associated with the emission of Syn radiation owing to relativistic electrons moving through the magnetic field of the collimated jet. The second peak is usually understood as a result of inverse Compton (IC) scattering of low energy photons to the highest energies, by the same relativistic electron population that generates these Syn photons (synchrotron self Compton model; SSC). The seed photons undergoing IC scattering can also come from outside regions, such as the accretion disk and broad line region, and can add an extra ingredient (external Compton models; EC) for modeling the observed SED.
Since the peak-power associated with the Syn bump tell us at which frequency ( ) most of the AGN electromagnetic power is being released, the parameter log(
 ) has been extensively used to classify blazars. Following Padovani & Giommi (1995) and (Abdo et al. 2010a,2010b), objects with log(
 ) < 14.5, in between 14.5 to 15.0, and >15.0 [Hz] are called low, intermediate, and high Syn peak blazars, i.e., LSP, ISP, HSP, respectively.
Blazars are by far the largest population of high galactic latitude sources in all Fermi-LAT catalogs and all types of blazars (LSP, ISP, and HSP) have been detected in γ-rays. Nevertheless, a relatively large percentage of LSPs still lack detection by Fermi-LAT. The fact that some of these LSPs are relatively bright in radio and show hints of distinct optical polarization properties (Angelakis et al. 2016) has motivated arguments about the existence of a specific class to represent the so-called γ-ray quiet blazars; the latter have a relatively lower polarization fraction. Therefore, current evidence gives us a hint of the jet condition regarding γ-ray undetected blazars, showing they might be connected to relatively less magnetized jets. In particular, Blinov et al. (2015) probed optical polarization swings in connection to periods of enhanced activity in γ-rays, therefore in connection with magnetic field strength and ordering within the jet structure. But the observations of orphan γ-ray flares, which have no counterparts at the low-energy site (optical to X-ray), are a standing challenge for current SSC and EC models when trying to describe blazar variability (Potter 2018). Alternative models such as the Ring of Fire(MacDonald et al. 2017) discuss evidence for a sheath of plasma surrounding the spine of the jet, producing a dominant IR photon field that would undergo IC scattering. Despite that, other works recognize γ-ray undetected blazars as MeV peaked (Paliya et al. 2017), which could be out of reach for Fermi-LAT.
As known, all Fermi-LAT official catalogs are blind with respect to other wavebands, meaning that information about sources detected in other energy bands are not taken into account. Each new γ-ray detection must meet the conservative requirement of being observed at least as a 5 σ excess compared to the expected background. This is usually incorporated in the so-called test statistic (TS) parameter (more on Sect. 3) translating to a TS > 25 requirement for acceptance of new γ-ray sources. This was necessary to avoid spurious detections and misleading associations, especially pre-Fermi-LAT, when the main population of γ-ray emitters was still to be identified.
The situation now has changed since the astrophysics community already recognize blazars as the main population of extragalactic γ-ray emitters. Searches for γ-ray emission in samples of previously known blazars can relax the TS > 25 requirement, as discussed in Arsioli & Chang (2017). These authors tested the existence of γ-ray signatures by including more information compared to a pure blind approach and they indeed detected 150 new γ-ray sources. The detection of new sources, together with resolving cases of source confusion, should not be neglected given its direct impact on statistical γ-ray properties of specific populations, particularly for small samples.
Especially in case of LSP blazars, the percentage of γ-ray undetected sources is higher. On average, those blazars have steep γ-ray photon spectral index (Ackermann et al. 2015b) that can compromise the detection of high redshift sources since the γ-ray SED shifts to lower frequencies in the observer rest frame. Also, the absorption of very high energy (VHE) γ-ray owing to the interaction with the extragalactic background light (EBL; Franceschini et al. 2008) may hinder observations with Fermi-LAT. In addition to those possible complications, intrinsic jet properties (such as the Doppler and beaming factor δ) and the dominant IC regime (either SSC or EC) may also have a large influence on the Fermi-LAT detectability of radio-loud blazars. In fact, Lister et al. (2009) showed that the γ-ray sources detected during the first three months of Fermi-LAT operations are associated with the largest apparent jet speeds (therefore, the largest bulk Lorentz factors) as deduced from radio measurements with the Very Large Baseline Array (VLBA). Also, Lister et al. (2015) showed that the γ-ray detection of LSP blazars is relatively less likely when the Lorentz factor is low and the Syn peak is below 1013.4 Hz. In fact, Sect. 4.5 presents three examples of radio-loud blazars with relatively bright νfν Syn peaks that are detectable only during short flare episodes. Those cases could provide hints of the mechanisms behind γ-ray flares and are interesting targets for upcoming missions such as the MeV dedicated e-Astrogram (Tatischeff et al. 2016; De Angelis et al. 2017).
Motivated by the possibility of unveiling new γ-ray sources, we use a complete sample of radio-loud blazars, and consider all cases not yet detected at GeV band for a likelihood analysis with the Fermi Science Tools. Our approach shows that most of the previously γ-ray undetected sources are actually detectable when integrating over 7.5 yr of observations or during short periods of their flaring states. We present γ-ray light curves adopting a one month time bin, showing that currently undetected blazars may introduce a dynamic high-energy component to the sky with numerous short periods of γ-ray activity. This might build a considerable portion of the extragalactic γ-ray background (EGB; Ackermann et al. 2013, 2015a) whose origin is still being debated (Di Mauro et al. 2014; Fornasa & Sánchez-Conde 2015; Di Mauro & Donato 2015; Ackermann et al. 2016a). In addition, undetected blazars may add anisotropic contributions to the EGB content especially at small angular scales (Ackermann et al. 2012; Cuoco et al. 2012; Inoue 2014), thus potentially affecting the search for dark matter annihilation or decay signatures in connection to diffuse γ-ray emission from extragalactic large-scale structures (Ando et al. 2014; Prokhorov & Churazov 2014). Indeed, our new detections may complement current understanding of the EGB origin especially for the MeV band where LSP and ISP blazars are more relevant.
Our detailed search for new γ-ray sources also provides a better description of the IC component for many blazars that so far had limited or no γ-ray data available, thus resulting in a measurement of Syn and IC peak-power parameters for nearly all sources (except for five nondetections). Since this radio sample includes the brightest and well-characterized LSP blazars, we study population properties such as the distribution of Syn and IC peak frequencies and peak power, and the distribution of log(νIC∕νSyn) and log(Compton dominance).
2 Sample description
We consider the complete sample of radio-loud AGN that was studied in detail by Planck Collaboration XV (2011), consisting of 104 northern and equatorial sources with declination larger than –10° and flux density at 37 GHz exceeding 1 Jy as measured with the Metsähovi radio telescope. We refer to those sources as the Radio-Planck sample and list these sources in Table A.1 showing their blazar names from 5BZcat (Massaro et al. 2015), and their NVSS1 radio counterpart. Out of these sources, 83 have a confirmed γ-ray counterpart in at least one of the Fermi-LAT (Atwood et al. 2009) catalogs, i.e., 1FGL, 2FGL, and 3FGL (Abdo et al. 2010b; Ackermann et al. 2011; Acero et al. 2015) or 2FHL and 3FHL (Ackermann et al. 2016b; Ajello et al. 2017). However, the nondetection by Fermi-LAT of the remaining 21 equally bright radio-loud AGN with similar radio-to-optical SED is intriguing, rising discussions on both the nature of the high-energy emission in blazars and the efficiency of Fermi-LAT in solving faint γ-ray sources (Lister et al. 2015). It has been argued that LSP blazars with νpeak < 1013.4 Hz may show a typical IC peak below 0.1 GeV out of the Fermi-LAT sensitivity bandwidth (0.1–500 GeV), so that we can only probe the very end of the IC component (Paliya et al. 2017).
3 γ-Ray analysis of undetected sources
In a blind analysis, the spectral parameters of a hypothetical source, such as normalization and photon spectral index, and also the source position itself (R.A. and Dec.) are all free parameters that have to be optimized during the data analysis. We might be able to reduce the uncertainty, however, with respect to position since we know multiple γ-ray blazar candidates that have already been identified from multifrequency observations from radio up to X-rays. Actually, a total of 21 sources in our Radio-Planck sample do not have a γ-ray counterpart in previous Fermi FGL catalogs. Those constitute a set of 21 seed fixed positions, for which we test the existence of relevant γ-ray signatures. This method has been successfully tested for a set of 400 γ-ray candidates (Arsioli & Chang 2017) preselected from a sample of HSP blazars, resulting in 150 new detections.
We performed a likelihood analysis integrating over 7.5 yr of Fermi-LAT observations in the 0.3–500 GeV band using Pass 8 data release (Atwood et al. 2013), and assuming the γ-ray spectrum of a new source could be described by a power-law model as
 (1)
(1)
where E0 is a scale parameter (also known as pivot energy), N0 is the pre-factor (normalization) corresponding to the flux density in units of ph cm−2 s−1 MeV at the pivot energy E0, and Γ is the photon spectral index for the energy range considered. Both Γ and N0 are set as free parameters and further adjusted by the fitting routine gtlike. Source positions and E0 = 1000 MeV are set as fixed parameters, therefore constants for the likelihood analysis. In the source-input xml file, all sources within 10° from the candidate had both Γ and N0 parameters flagged as free2. Therefore, the 3FGL models of these sources, which are based on four years of observations were adjusted, since we integrated over 7.5 yr of data. This particular choice increases the computational burden of the analysis, but it is crucial for adapting the model maps to the extra 3.5 yr of exposure that is being considered. Results are shown in Table 1, listing only the 16 cases that had no known counterpart from previous γ-ray catalogs and which we now describe case by case in this work. Also, we note that Table A.1 holds the description for the entire Radio-Planck sample.
Since we are dealing with sources that are predominantly LSP blazars, we should expect them to have steep γ-ray SED (in log(νfν) versus log(ν) plane) as observed from the correlation in Γ versus  plane (Acero et al. 2015), where LSP sources dominate the Γ > 2.0 side. The parameter N0 represents the flux at 1 GeV (given our choice for E0). Therefore, new detections are expected to be on the border or below Fermi-LAT four-year sensitivity limit3, which is E2dN∕dE ≈ 2.0 × 10⁻¹² erg cm−2 s−1 at 1 GeV, i.e., dN∕dE ≈ 12.5 × 10⁻¹³ ph cm−2 s−1 MeV. Following our results as reported in Table 1, few cases have N0 above the the Fermi-LAT four year sensitivity level. In particular 5BZQJ 0359+5057 and 5BZUJ 0241–0815 have larger N0, which is clearly a consequence of an enhanced γ-ray activity reported just after 2013 (out of the integration period used to build the 3FGL catalog) as discussed in Sects. 4.1 and 4.5. Another three sources flagged with “b” have N0 close to the 3FGL sensitivity border; those are actually detected in the 3FGL catalog but with large position uncertainty, which lead them to be unassociated in previous catalogs.
Positive γ-ray signatures were first evaluated based on test statistics (TS) values as defined by Mattox et al. (1996):  , where L(no source) is the likelihood of observing a certain photon count for a model without the candidate source (the null hypothesis), and L(source) is the likelihood value for a model with the additional candidate source at the given location. The reported TS values correspond to a full band fitting, which constrains the whole spectral distribution along 0.3–500 GeV to vary smoothly with energy and assuming no spectral break. Considering that we have a good description of the Galactic and of the extragalactic diffuse components, this is a measure of how clearly a source emerges from the background, also assessing the goodness of free parameters fit.
A TS ≈ 25 is equivalent to a 4–5σ detection, depending on the strength of the background in the region (Abdo et al. 2010b), and only cases with TS > 25 are considered by the Fermi-LAT team as a positive detection of a point-like source. Following the discussion on Arsioli & Chang (2017), we analyzed γ-ray signatures down to TS = 10, which are spatially consistent with blazars already known from other energy bands and double checked these with TS maps.
A TS map consists of a pixel grid where the existence of a point-like source is tested for each pixel, and each grid bin is evaluated using a likelihood analysis4. Since the PSF improves with energy, we worked with E > 500 MeV photons to help us determine the TS peak position with better precision than working at lower Fermi-LAT bandwidth (down to 100 MeV). Thus the map alone tests the existence of a point-like source emerging from a flat low-TS background.
We enhanced the γ-ray characterization of the Radio-Planck sample by ≈15%, since we now describe ten new detections of steady sources as discussed in Sects. 4.1, 4.2, and 4.4; three new associations from improved position of previously known 3FGL sources as discussed in Sect. 4.3; and three detections of sources with isolated flaring activity as discussed in Sect. 4.5. In the following discussion we present fitting parameters, SEDs, light curves for most relevant cases, and TS maps for all sources. We comment on four cases where we find poor evidence of γ-ray signature, which is probably related to high redshift, IC peak at MeV band, and low galactic latitude hindering the detection.
For the light curves, we usually considered a time bin of approximately 30 days, and estimated the corresponding flux and errors only when the TS per bin was larger than 4.0. When this condition was not satisfied, an upper limit to the flux was calculated using the integral method (provided by the Fermi Science Tool), which takes into account the background level and spectral properties of the test source.
4 New γ-ray detections, validation, and association
We present new γ-ray signals down to TS ≈ 10 level. We also describe one case of source confusion, solve three cases of unassociated 3FGL sources, and comment on the nondetections as well. Table 1 shows the power-law parameters resulting from the fit in the 0.3–500 GeV energy band, together with redshift of the counterpart, Syn, and IC peak frequency (νpeak), and flux density (νfν) for all cases studied. For each source, we present a TS map together with the γ-ray SED with a polynomial fit for both Syn and IC component. Following Giommi et al. (2012b), when fitting the nonthermal component we also account for optical and UV thermal emission due to accretion using the composite optical spectrum built by Vanden Berk et al. (2001). This thermal template is based on 2200 optical spectra of radio-quiet quasars (QSOs) taken from the SDSS database and its expected soft X-ray emission, from Grupe et al. (2010).
The TS maps are calculated considering only photons with E > 500 MeV, which is a good choice to evaluate the TS spatial distribution for these radio sources, since they usually have a photon spectral index in the range 2.0 < Γ < 3.0. Whenever possible, we also use E > 1.0 GeV photons (or higher) to improve the localization of γ-ray signatures. We call attention to the fact that for most cases we are dealing with relatively faint γ-ray sources, therefore the TS distribution could peak at a position slightly offset from it counterpart. An offset is expected given the uncertainty introduced by the large PSF, which is on the order of 1.4° at 500 GeV (Atwood et al. 2013) and 0.81° at 1 GeV level. Following the discussion in Abdo et al. (2010b) what is important to ensure a proper match is that the 68% confinement region for the γ-ray signature should enclose the counterpart blazar. This is explicitly shown case by case to help validate our new detections and associations.
We show the light curves with monthly bins for those cases for which we identify a γ-ray flaring activity during the 7.5 yr covered by Fermi-LAT. Light curves are computed with likelihood analysis, therefore the background is extracted and flux points are calculated only for time bins that have TS > 4. For all cases we compute upper limits and errors bars using the integral method assuming a 95% confidence level, as provided by the Fermi Science Tools. When relevant for the discussion, we also show the significance of the γ-ray signatures based on the 3FGL setup (i.e., likelihood analysis with 4.0 yr of Pass 7 data) to test if those sources could have been identified previously.
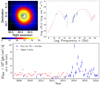 |
Fig. 1 5BZQJ 0359+5057. Top left panel: TS map considering only E > 0.5 GeV photons with black dashed lines representing 68%, 95%, and 99% containment regions for the γ-ray signature (used for all further TS maps), considering the brightest period from 2014 to 2015; 5BZQJ 0359+5057 is marked with a circle centered at “+”. Top right panel: the SED with a polynomial fit to the mean Syn and IC components; the blue-bump feature between 1014 and 1018 Hz (Vanden Berk et al. 2001) for a source at z = 1.512. In the γ-ray band, red points represent the SED before flaring (before 2013), while blue is for the flaring period (after 2013). Bottom panel: 0.3–500 GeV light curve along 7.5 yr of observations with bins of 30 days; red points represent upper limit flux. |
4.1 Notes on individual objects
We present adetailed description for the new γ-ray detection, which showed TS > 20 when integrating over 7.5 yr of observations. Those cases are relatively isolated, meaning there are no other close by γ-ray counterparts that could contaminate the observed signatures. For the discussion we include TS maps, light curves, and spectralpoints. Together, those elements build an entire picture, not only validating and describing their γ-ray properties, but also explaining (whenever necessary) why those sources were not previously detected, showing examples on how the data treatment is refined with multifrequency information, leading to more efficient use of public databases.
5BZQJ 0359+5057. Computing a TS map in the 0.5–12 GeV energy range (Fig. 1), we identified a bright point-like source clearly emerging from a low and flat TS background. The light curve plotted in Fig. 1, shows that the source 5BZQJ 0359+5057 (4C + 50.11) was undetectable by Fermi-LAT, most of the time with the exception of the period between June 2013 and April 2016 when it underwent a phase of strong γ-ray activity. This is consistent with its nondetection up to the 3FGL catalog (since 3FGL only integrate observations from August 2008 to August 2012).
To reproduce the 3FGL setup, we performed a likelihood analysis with Pass 7 data, integrating only during the first four years of observations. As result we found TS = 15.2, with model parameters N0 = 8.1 ± 2.2 × 10⁻¹³ ph cm−2 s−1 MeV−1 and Γ = 2.55 ± 0.19, using E0 = 1000 MeV as pivot energy. Hence, this source was out of the 3FGL catalog simply because it did not meet the TS > 25.0 criteria. We also noticed that the parameters estimated at the time of 3FGL catalog were already in good agreement with those we present on Table 1, showing that γ-ray signatures at 10 to 25 TS level contain rich information, as discussed in Arsioli & Chang (2017).
As an exercise, we used a setup similar to 3FGL (integrating over 2008–2012) but now with PASS 8 data. This results in a firm detection with TS > 25 and the γ-ray SED shown as red points in Fig. 1 (bottom panel). This give us a solid idea on how the Pass 8 data release brings way relevant enhancements for the description of the γ-ray sky.
5BZQ J1955+5131. This blazar shows a strong γ-ray signal when integrating over 7.5 yr with Pass 8 data, but from the light curve (Fig. 2) we measured significant flaring activity only after 2014. A likelihood analysis integrating Pass 7 data from August 2008 up to August 2012 (hereafter we refer to this as the 3FGL setup) have shown  5.0, and therefore this source is out of the 3FGL catalog because of its variability. In addition, this blazar is close to the galactic plane (b = 11.7°), where the low-energy diffuse background is more intense thus hindering detections of faint γ-ray sources. In fact, owing to larger background levels, the Fermi-LAT sensitivity in the Galactic plane region is lower than at high Galactic latitude5.
5BZUJ 0909+4253. This blazar is strongly detected when integrating over 7.5 yr with Pass 8 data ( = 74.4), but shows no strong flaring activity as can be seen in Fig. 3. A likelihood analysis with the 3FGL setup gives
  14.2, with power-law parameters N0 = 2.4 ± 0.8 × 10⁻¹³ ph cm−2 s−1 MeV−1, Γ = 3.04 ± 0.38, using E0 = 1000 MeV as pivot energy, which agrees with values reported in Table 1. This is another example for which it would be beneficial to have preliminary information about faint signatures with TS in between 10 and 25, which were already available with 4 yr Pass 7 data. The TS map (Fig. 3) confirms that the observed γ-ray signature emerges as a point-like source from a low-TS background.
5BZQ J1153+8058. From the light curve (bottom panel of Fig. 4), this source shows γ-ray activity only in 2014, which is consistent with its noninclusion in the 3FGL catalog (3FGL covers the period of 08/2008-08/2012). A likelihood analysis with 3FGL setup results in null detection. For this case, we are likely probing the peak of a transient γ-ray activity during the year 2014, and smoothing out the signal along 7.5 yr of binned analysis. The detection of a steady high-energy component (non-flaring state) is currently limited by the Fermi-LAT sensitivity. Therefore, the parameters reported on Table 1 embody the mean γ-ray spectrum behavior and represent a good example of how γ-ray activity is washed out for the building of current high-energy catalogs that integrate Fermi-LAT observations over 4.0 yr (in case of the 3FGL) to 7.5 yr. We built a TS map (top left panel in Fig. 4) integrating along the whole year of 2014, showing that the blazar position is compatible with the γ-ray signature within the 68% containment region. This case in particular allowed us to use E > 3.0 GeV photons instead of E > 500 MeV, providing improved localization.
5BZQJ 0646+4451. Although this source is located in a relatively crowded region close to the Galactic plane (|b| = 17.9°), the low-energy detection is very significant with  80 in the 300–550 MeV energy bin alone. We found no significant flaring activity during the 7.5 yr of observations with Fermi-LAT, and the period with the most significant γ-ray signature extends from October 25 to November 30, 2010. The highest energy photons detected from this region are ~10 GeV, and therefore we built a TS map in the 500 MeV–12 GeV energy range (Fig. 5, left panel). The γ-ray signature emerges as a point source fully compatible with the blazar position. In particular, the γ-ray counterpart has high redshift of z = 3.396, and absorption due to EBL might hinder the detection of VHE photons.
A likelihood analysis using the 3FGL setup has shown  = 20.3, with pivot energy E0 = 1000 MeV, pre-factor N0 = 2.6 × 10⁻¹³ ph cm−2 s−1 MeV−1, and Γ = 3.61, which is in good agreement with the parameters presented in Table 1. This is another example of low-significance γ-ray signature with TS between 10 and 25, which would have been beneficial to report on without compromising the spectral description (that can be refined with longer integration time as shown).
5BZQJ 0125–0005. This source has been detected with TS ≈ 20 when integrating over 7.5 yr with Pass 8 data. Its light curve does not present strong flaring episodes, but we identify the most relevant bin as July 31 to August 31, 2013, as used to build the TS map. Although the TS value is below 25, we consider it a firm detection since the TS map (Fig. 6) clearly shows the γ-ray point-like signature emerge froma low-TS background, and the 68% confinement region is compatible with the blazar position. A likelihood analysis with the 3FGL setup gives  = 12.9 with parameters E0 = 1000 MeV, N0 = 2.8 × 10⁻¹³ ph cm−2 s−1 MeV−1, and Γ = 2.68, again in agreement with parameters from Table 1.
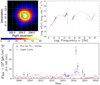 |
Fig. 2 BZQJ 1955+5131. Top left panel: TS map considering only E > 0.5 GeV photons, during the high-state period between 2014 and 2015. Top right panel: SED for 5BZQJ 1955+5131 at z = 1.21, with the newγ-ray spectrum in the 0.3–500 GeV band. As example, in the 1022 –1026 Hz band (0.1–500 GeV), we show the Fermi-LAT sensitivity limit when integrating over four year of observations. Bottom panel: the γ-ray light curve for 5BZQJ 1955+5131 along 7.5 yr of observations and with time bin of 30 days. |
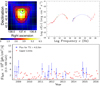 |
Fig. 3 5BZUJ 0909+4253. Top left panel: TS map considering only E > 0.5 GeV photons during the brightest period, from January 6 to February 6, 2009. Top right panel: SED for 5BZUJ 0909+4253, z = 0.670. Bottom panel: the γ-ray light curve along 7.5 yr of observations. |
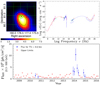 |
Fig. 4 5BZQJ 1153+8058. Top left panel: TS map using E > 3.0 GeV photons collected during the 2014 flaring period. Top right panel: SED for 5BZQJ 1153+8058 also showing the template for thermal emission from accretion in the range 1014 –1018 Hz assuming z = 1.250. Bottom panel: the γ-ray light curve for 5BZQJ 1153+8058 along 7.5 yr. |
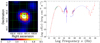 |
Fig. 5 5BZQJ 0646+4451. Left panel: TS map considering 500 MeV to 12 GeV photons and integrating over the flaring period from October 25 to November 30, 2010. Black dashed lines represent 68% and 95% confinement regions for the γ-ray signature. Right panel: SED for 5BZQJ 0646+4451, also showing the blue bump template assuming z = 3.396. |
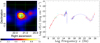 |
Fig. 6 5BZQJ 0125–0005. Left panel: TS map considering only E > 500 MeV photons and integrating data along the brightest month from July 31 to August 31, 2013. Black dashed lines show the 68% and 95% confinement region for the γ-ray signatures. Right panel: multifrequency SED for 5BZQJ 1153+8058 with the blue bump template corresponding to z = 1.077. |
4.2 Source confusion
We discuss a case in which source confusion involving a steep and a hard spectrum γ-ray source is likely present. Even though no γ-ray source is reported within 1° of 5BZQJ 1642+6856 in any of the FGL catalogs, our likelihood analysis finds a γ-ray signature matching the position of this source, which is located only ~10 arcmin from the HSP blazar 2WHSPJ 164014.8+685233. Indeed, the high-energy E > 1.0 GeV TS map (Fig. 7 in top left panel) reveals a dominant γ-ray signature coincident with the 2WHSP source, however extending toward the position of 5BZQJ 1642+6856. We then consider photons in the 0.1–500 GeV band and a likelihood function including two nearby point-like emitters, which gives us an estimate of the γ-ray spectral properties for each source as shown in Table 2. Despite the low statistical significance associated with BZQJ 1642+6856 γ-ray signature (TS < 10), we note that the photon spectral index Γ estimated for the pair 5BZQ & 2WHSP is consistent with the hypothesis of confusion between a steep and a hard component as expected fornearby LSP and HSP blazars.
As a consistency test, we built an additional high-energy TS map (E > 1 GeV) by adding a point-like source at the 2WHSP position modeled as a power-law with the same parameters as from Table 2, such that the 2WHSP γ-ray signature is now part of the background model. As a result (Fig. 7, top right panel) we reveal a residual point-like signature consistent with 5BZQJ 1642+6856 within the 68% confinement radius. All together, it suggests this might be a case of source confusion, which is hard to resolve with currently available data. Since those γ-ray signatures have not been reported in previous high-energy catalogs, we present 2WHSPJ 164014.8+685233 as a new detection and 5BZQJ 1642+6856 as a relevant signature, whose resolved SEDs are shown in Fig. 7 (middle and bottom panels).
4.3 New associations from improved positions determination
Arsioli & Chang (2017) showed that high-energy TS maps can be used to improve the localization for many γ-ray signatures currently listed in FGL catalogs. It is well known that the Fermi-LAT detector (Atwood et al. 2009) is characterized by a highly energy-dependent point spread function (PSF), which contains 68% of the 1 GeV events within 0.8°, decreasing afterward with a trend ∝ E−0.8 up 10’s GeV, and finally roughly constant at 0.1° up to the highest energies considered in this paper. Therefore, working with E > 1 GeV allows us to better constrain the position associated with the γ-ray signature, which helps solve cases of source confusion. This is particularly important for unassociated 3FGL (Acero et al. 2013) that are actually counterparts of close by blazars. We present two such cases, noting that an approach based on the prior multifrequency identification of nearby blazars certainly improve the γ-ray associations with potential counterparts.
3FGLJ 0432.5+0539. We present an improved position reconstruction for the source 3FGLJ 0432.5+0539, for which no association is reported on the 3FGL catalog. We build a TS map using only photons with E > 2 GeV and removing the 3FGL source from the background model.
Figure 8 shows that the 68% containment region for the γ-ray signature is fully consistent with the position of BZUJ 0433+052, while the 3FGL position (magenta dashed circle on the top left panel) is well outside of the 99% confinement region for the high-energy TS peak. Although part of the improvement could be ascribed to the better instrument response function (IRF) and event selection of the Pass 8 data release with respect to the Pass 7 as used for 3FGL production, it should be noted that high-energy TS maps has proven to provide a significant contribution in source positioning.
3FGLJ 0556.2+3933. This is another case of a 3FGL source with no association that benefits from an improved position reconstruction. As shown in the top right panel of Fig. 9, there is no relevant radio or X-ray counterpart that is compatible with the 95% positional error ellipse for the 3FGL source (dot-dashed line). However, a powerful blazar is only ~18 arcmin away. Indeed, building a TS map using high-energy photons (with E > 1 GeV) we are ableto show that the 68% confinement radius for the γ-ray signature is fully consistent with the position of 5BZQJ 0555+3948. In addition, the γ-ray spectrum we obtained is compatible with expectations for the end tail of the IC bump.
3FGLJ 0228.5+6703 and its correct counterpart. Blazar 5BZQJ 0228+6721 had no γ-ray counterpart in previous FGL catalogs, however a γ-ray source at its vicinity was detected (1FGLJ 0233.4+6654) but with no consistent position. In this same region, the source 3FGLJ 0228.5+6703 has been associated with a radio source GB6J 0229+6706 (GB: from Green Bank 4.85 GHz northern sky survey, Gregory et al. 1996) which is within the 3FGL error circle (dot-dashed line, Fig. 10top left panel). This field is difficult to study because it is very close to the Galactic plane (at latitude b ~ 6o) and the intense low-energy diffuse γ-ray background can hinder both the source localization and detection when integrating over the full energy bandwidth.
Since the 3FGL position is only 5.94 arcmin from the blazar, we investigated whether we could improve the γ-ray localization of this source working with E > 500 MeV photons, benefiting from lower background intensity, improved PSF, and longer integration time (from 4.0 to 7.5 yr). We calculated the E > 500 MeV TS map (Fig. 10, top left panel) showing that the 68% containment region for the γ-ray signature is compatible with 5BZQJ 0228+6721 (while GB6J 0229+6706 is out of the 99% containment region) and therefore the 3FGL association should be revised. We recalculated the γ-ray SED (Fig. 10, bottom panel) assuming a single source with position corresponding to 5BZQJ 0228+6721, and found it is consistent with the end-tail IC bump.
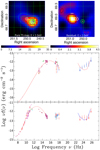 |
Fig. 7 BZQJ 1642+6856. Top left panel: TS map for E > 1.0 GeV. The green thin lines show contours corresponding to TS values of 15, 12, 8, and black dashed lines represent 68%, 95%, and 99% containment region. Top right panel: residual TS map for E > 1 GeV considering a source placed at the 2WHSP position, indicated with green cross, as part of the γ-ray background; in this case the black dashed line corresponds to the 68% confinement radius for the γ-ray source, while the white cross indicates the position of BZQJ 1642+6856. Middle and bottom panels: SEDs for 2WHSPJ 1640+6852 for which no optical identification is available yet, and BZQJ 1642+6856 with z = 0.751. The upper limits on the γ-ray spectra have been calculated only for energy bins with low significance. |
Source model parameters derived from the Fermi Science Tools assuming a power-law to describe the γ-ray spectrum within the 0.1–500 GeV energy band, with N0 given in ph cm−2 s−1 MeV−1, and assumingE0 = 1000 MeV.
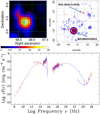 |
Fig. 8 5BZUJ 0433+0521. Top left panel: TS map built using only photons with E > 2.0 GeV; Black dashed lines show 68%, 95%, and 99% confinement regions. The position of a nearby BZU source is highlighted by the green circle around the “+” marker, while 3FGL detection is center on the magenta dashed circle. Top right panel: an image obtained from the SSDC Sky-Explorer showing that 5BZUJ 0433+0521 position is inconsistent with 3FGLJ 0432.5+0539 detection also taking into account its 95% positional uncertainty (dot-dahsed ellipse). Blue and red circles represent respectively X-ray and radio frequency detections in the same region as taken from publicly available data. Bottom panel: SED for 5BZUJ 0433+0521 with blue bump template for z = 0.033. |
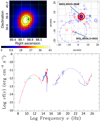 |
Fig. 9 5BZQJ 0555+3948. Top right panel: Sky-Explorer view, showing 3FGLJ 0556.2+3933 indicated as a red cross, while 5BZQJ 0555+3948 is outside the error circle associated with the γ-ray signature from 3FGL database. Blue and red circles represent X-ray and radio detections in this region. Top left panel: TS map, E > 1.0 GeV with improved position for the γ-ray signature; Black dashed lines show the 68%, 95%, and 99% confinement region for the γ-ray signatures. The dashed magenta circle corresponds to the 3FGLJ 0556.2+3933 position, while the green circle is centered on the position of 5BZQJ 0555+3948 marked as black cross. Bottom panel: SED for 5BZQJ 0555+3948, where the blue bump template assumes z = 2.365. |
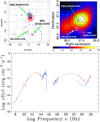 |
Fig. 10 5BZQJ 0228+6721. Top left panel: Sky-Explorer view, showing 3FGLJ 0228.5+6703 marked with “x” symbol, and dashed line for the error circle associated with the 3FGL γ-ray signature. We also highlight the positions of GB6 J0229+6706 and 5BZQJ 0228+6721. The red and blue circles represent radio and X-ray detections in the field. Top right panel: TS map considering E > 500 MeV photons, with dashed lines representing 68%, 95%, and 99% containment region for the γ-ray signature; 5BZQJ 0228+6721 is center at “+” matching the TS peak position. Bottom panel: SED for 5BZQJ 0228+6721, with blue bump assuming z = 0.523. |
4.4 Low-significance γ-ray excesses
We present sources showing faint γ-ray signature 10 <TS < 20 when integrating over 7.5 yr of Fermi-LAT observations. It is important to report on faint detections, especially to clarify if these sources are actually γ-ray active, but under the TS limit currently used by the Fermi team, or if they are really quiet in the γ-ray band. Also, low-significance γ-ray detections help to complement the source number count in the faint end of the log N-log Sγ, and therefore can impact estimates of the contribution of blazars to the E < 1 GeV extragalactic γ-ray background. We found the light curves for 5BZQJ 2218−0335, 5BZBJ 0006−0623, and 5BZQJ 1038+0512 show short-lived activity at the timescale of a month, and we report on their TS maps (Fig. 11) and preliminary power-law modeling.
As seen from the TS maps (Fig. 11), only 5BZQJ 1927+7358 is out of the 68% containment for the γ-ray signature. In this case, the observedTS value (Table 3) when integrating over 7.5 yr of observations can be attributed to residual signal from an unidentified close-by γ-ray source. For now, weconsider it as a likely spurious signal.
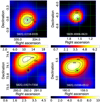 |
Fig. 11 TS maps for the low-significance γ-ray detections using only E > 500 MeV photons. For each case the blazar position is highlighted with thick green circle center at “+”. Black dashed lines show the 50%, 68%, and 95% containment radius for the γ-ray signature. |
Source model parameters from Fermi Science Tools, assuming a power-law to describe the γ-ray spectrum within 0.1–500 GeV, with N0 given in [ph cm−2 s−1 MeV−1], and using E0 = 1000 MeV as pivotenergy.
4.5 Detections during flaring episodes
We present the γ-ray analysis for three radio-loud blazars that have relatively bright νfν Syn peak, 5BZQJ 0010+1058, 5BZUJ 0241–0815, and 5BZQJ 2136+0041, for which the detection with Fermi-LAT was expected but not yet reported. This brings us to an important consideration about the role of short-lived flares at monthly timescales since a considerable portion of γ-ray active sources could be still undetected simply because their short-lived signatures are diluted below the sensitivity threshold when integrating Fermi-LAT observations over long exposure time.
5BZQJ 0010+1058. This object is a radio-loud source (also known as MRK 1501) for which γ-ray detection was expected since it is a relatively bright and close-by blazar with νfν= 10−10.7 erg cm−2 s−1 and z = 0.089. When integrating over 7.5 yr, no γ-ray signature was evident (TS ≈ 0.0). Nevertheless, its light curve (Fig. 12, bottom panel) shows fast (within the timescale of a month) and relatively bright flares, almost reaching two orders of magnitude variability with respect to the background. When running a likelihood analysis integrating only for the duration of the flare, June 18, 2009 to October 31, 2010, we could characterize the short-lived γ-ray spectrum, reaching TS ≈ 26 for the single month bin of June 2010. In this case (Fig. 12, top right), the upper limits calculated for the γ-ray SED are less restrictive, since we are integrating over a single month. We checked for coincident X-ray measurements from Swift (along the γ-ray flaring activity from June 2009 to May 2010), but for the observations made in February 2010 we could find no sign of strong X-ray flaring. This is a good example of transient γ-ray source, which we could only detect by means of a dedicated study focusing on blazars as γ-ray candidates.
NGC1052; 5BZUJ0241–0815. In this case, the light curve shows a flaring state during 2013 to first quarter of 2014. From March 7 to April 7, 2014 the γ-ray signature reaches its highest state, at which TS ≈ 12. A TS map at E > 500 MeV (Fig. 13) shows that 5BZUJ 0241-0815 is within the 68% confinement region for the γ-ray signature. This blazar of unknown type is another example of a transient γ-ray emitter, which may contribute to building the currently unresolved γ-ray background. It is still not clear how to evaluate the impact of such sources for the observed extragalactic diffuse γ-ray component given that transient populations are not yet fully characterized.
5BZQJ 2136+0041. This source is classified as a FSRQ with z = 1.941, and for this case we detected a short-lived γ-ray flare from January 2 to February 2, 2014, where TS ≈ 7.5. A TS map integrating over E > 300 MeV photons (Fig. 14, top left panel) shows that the signature emerges as a point-like source and the 68% containment region is compatible with 5BZQ J2136+0041 position. Although the γ-ray signature has low significance, it is important to report it as a potential faint γ-ray transient. Since we integrated along short time period, the lower limits computed in the γ-ray SED (Fig. 14, top right panel) are not so restrictive.
From the three cases presented in this section, two questions clearly arise: How many AGNs could have short-lived flares, and how important is their integrated contribution to the γ-ray background probed by Fermi-LAT (Ackermann et al. 2015a) in the 100 MeV to 800 GeV energy range?
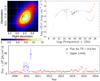 |
Fig. 12 5BZQJ0010+1058. Top left panel: TS map considering E > 500 MeV photons during a short-flare episode at MET: 296164808–298860398. Black dashed lines representing 68% and 95% containmentregion for the γ-ray signature. Top right panel: the corresponding SED of this object. Bottom panel: light curve for 5BZQJ 0010+1058 background extracted with likelihood analysis; flux points are calculated only for bins having TS > 4 with a 30 day time bin along 7.5 yr of observations, integrating 0.3–500 GeV photons. |
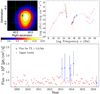 |
Fig. 13 5BZUJ 0241–0815. Top left panel: TS map for E > 500 MeV during a short-flare episode at MET: 415846402-418598890. The blazar position is highlighted by the green circle center at “+”; the black dashed-lines are TS surfaces corresponding 68%, 95%, and 99% confinement region for the γ-ray signature. Top right panel: the corresponding SED of this object; the green template corresponds to the elliptical galaxy emission at z = 0.005. Bottom panel: light curve for 5BZU J0241–0815. Flux points are only calculated for bins with TS > 5 with a 30 day time bin along 7.5 yr of observations, integrating 0.3–500 GeV photons. |
4.6 Fermi-LAT nondetections
We report on four Radio-Planck sources (5BZQJ 0927+3902, 5BZQJ 2139+1423, 5BZQJ 2022+6136 and 5BZQJ 2007+4029) for which we could not find evidence of γ-ray signature during the 7.5 yr of observations.
5BZQJ 0927+3902. This is a bright radio blazar (z = 0.695) about 46.1 arcminutes away from 3FGL J0923.1+3853 (which is associated to B2 0920+39). We investigate this region with a TS map, looking for signs of source confusion, but we could find none. The 3FGL γ-ray signature dominates the emission in this region as seen by the low-energy TS map (Fig. 15, left panel); the SED for 5BZQJ 0927+3902 (Fig. 15, right panel) has no of γ-ray information. This is likely a good proxy for blazars with an IC component that is MeV peaked just as the following cases: 5BZQJ 2139+1423, 5BZQJ 2022+6136, and 5BZQJ 2007+4029.
5BZQJ 2139+1423. This blazar is classified as FSRQ, with relatively high redshift, z = 2.427. A light curve with one month bins along 7.5 yr showed no bins with TS > 3.0. However, we do not discard γ-ray activity for this source. The IC component probably peaks at a frequency that is much lowerthan the bandwidth probed by Fermi-LAT, owing to its LSP frequency log(νpeak) ≈ 11.0. In addition, because of its high redshift, the observed IC end tail gets even harder to probe.
5BZQJ 2022+6136. This source is also classified as FSRQ, although there is no good fitting between the optical to X-ray data and a blue-bump template (with z = 0.228). There is a single episode from 27 September to 28 October 2011 for which a low significance γ-ray signal (TS = 4.1) is present.
5BZQJ 2007+4029. This object is close to the Galactic plane, at latitude b = 4.30°, with relatively high redshift, i.e., z = 1.736. A likelihoodanalysis integrating over 7.5 yr, considering the full energy band 0.1–500 GeV shows a very low-significance γ-ray signature, where TS ≈ 5.2, Γ = 2.61 ± 0.26, and N0 = 2.4 ± 1.2 × 10¹³ ph cm−2 s−1 MeV−1. However, from the TS map (300 MeV–10 GeV) there is no clear evidence for a point source, therefore we do not consider this as detection.
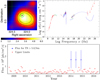 |
Fig. 14 5BZQJ 2136+0041. Top left panel: TS map for E > 300MeV during a short-flare episode at MET: 410341424 413093913. The blazar position is highlighted by a green circle withcenter at “+”. The black dashed lines correspond to 50% and 68% confinement radius for the γ-ray signature. Top right panel: the corresponding SED of this object; the blue bump template assumes z = 1.941. Bottom panel: light curve for 5BZQJ2136+0041, flux is calculated only for TS > 5 bins, with a 30 day time bin along 7.5 yr of observations, integrating 0.3–500 GeV photons. |
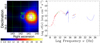 |
Fig. 15 5BZQJ 0927+3902. Left panel: TS map for 750–950 MeV photons. The blazar 5BZQJ 0927+3902 is highlighted as a green circle and 3FGL is shown in magenta. Right panel: the SED with a polynomial fit to the mean Syn and the blue-bump template are represented for z = 0.695. In the γ-ray band, the blue curve in the 1022–1026Hz band (0.1–500 GeV) represents the Fermi-LAT four year sensitivity threshold, therefore an upper limit for the γ-ray emission. |
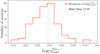 |
Fig. 16 Distribution of log( |

5 Radio-Planck sample properties
In previous sections, we showed that 99 of the 104 objects in the Radio-Planck sample have evidence for γ-ray emission at relevant level when integrating over 7.5 yr of observation or during flaring episodes. By fitting the Syn and IC components with a third-order polynomial (Giommi et al. 2012b), we estimate their SED peak parameters (Table A.1) using all available nonsimultaneous data. In particular, the γ-ray points are from the3FGL catalog in the case of previously detected sources, and from our own data reduction in the case of newly detected sources, considering 7.5 yr of Fermi-LAT observations; we also study statistical properties related to the nonthermal peak parameters.
5.1 Synchrotron and IC peak parameters
In Fig. 16 we plot the distribution of log( ), showing that the Radio-Planck sample is dominated by LSP blazars, with mean value ⟨log(
 )⟩ = 12.94 ± 0.076 [Hz]. This is because our sample is flux limited in the microwave band where blazars of the LSP type are by far the most abundant objects.
In Fig. 17 we plot a histogram showing the distribution of log(νfν) peak values for both Syn and IC bumps. A parametric Kolmogorov-Smirnov (KS) test comparing both histograms gives a pvalue = 0.86, implying that the luminosity distributions of both components are similar. In fact, the mean values of the peak fluxes are relatively close, i.e., ⟨log(νf )⟩ = −11.11 ± 0.05 [erg cm−2 s−1]; ⟨log(νf
 )⟩ = −10.94 ± 0.05 [erg cm−2 s−1]. This similarity in the peak power distribution of the two components suggests that on average the ratio of νf
 to νf
to νf values might be close to one for the population of LSP blazars.
5.2 Peak ratio parameter
The  and
and  parameters, which are determined in the log(νfν) versus log(ν) plane, are very representative of blazar SED properties because they give the peak energy where most of the Syn and IC power are emitted.To study their statistical properties, we define the peak ratio (PR) parameter as the logarithm of νpeak ratios:
 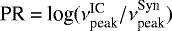 and plot its distribution (Fig. 18). We determine the characteristic mean value for PR when considering all LSP blazars: ⟨PRall⟩ = 8.60 ± 0.09. We also show the distribution of PR values for the subsamples classified as 5BZB (BL Lacs), where the mean value ⟨PRBL Lacs⟩ = 8.42 ± 0.20 and 5BZQs(FSRQ), where the mean value ⟨PRFSRQ⟩ = 8.75 ± 0.09. There are no significant differences for the average PR parameters, since variations are contained within errors.
In Fig. 19 we show the log( ) distribution for all 98 LSPs with available IC data (in blue), which has mean value of ⟨log(νIC)⟩ = 21.53 ± 0.90 [Hz]. We then use the ⟨PRall⟩ value to estimate
  based on the
  according to log(
 ) = log(
 ) + ⟨PRall⟩. The distribution of
  calculated via ⟨PRall⟩ parameter is shown in pink, which is indeed well described by this simple relation. Most likely, there is a dominant process connecting Syn and IC bumps, otherwise such correlations would not show up. If multiple emission scenarios were at work, we would expect large spreading in the parameter space, not tight Gaussian distributions. As known, the most established picture to describe the SED shape assumes dominant SSC leptonic scenario, but there is extensive discussion in the literature considering the role of the EC for different blazars, even reporting on observable evidence (Meyer et al. 2012).
A scatter plot with log(νIC) values versus log(νSyn) + ⟨PRall⟩ shows that there is only marginal evidence for the correlation between those parameter (Fig. 19, bottom panel) given that the Pearson’s correlation coefficient r for a linear fit is ~0.17. The fact that the PR parameter helped to describe the distribution of log(νIC) as a population, tells us that the log(νIC) measured by our fitting might have large uncertainties; given the absence of a significant correlation, when comparing case by case with the scatter plot. Indeed there is a large uncertainty for that parameter mainly due to the huge data gap in the energy window between tens of KeV up to hundreds of MeV, which is smoothed out when considering the whole population of bright LSP sources.
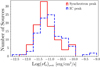 |
Fig. 17 Histogram of log(νfν) at the Syn peak (in red) and the IC peak (in blue), considering all 99 sources in the Radio-Planck sample for which we could estimate the Syn and IC peak parameters. |
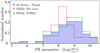 |
Fig. 18 Peak ratio log( |

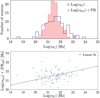 |
Fig. 19 Top panel: distribution of log( |


5.3 Compton dominance
The ratio of IC to Syn peak power is known as the Compton dominance (CD). This is an important parameter for describing blazar SEDs(Finke 2013; Potter & Cotter 2013; Nalewajko & Gupta 2017), since it measures the dominant power output component for each source, i.e.,
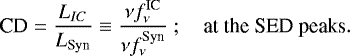 (2)
(2)
Luminosity is written as L = 4πd νfν/(1+z)1−α, where dL represents the luminosity distance and the (1+z)1−α factor is the k-correction assuming a power-law spectrum with energy index α. Since we calculate the CD using the luminosity ratio at the peak power, α = 1 for both IC and Syn peaks, and the luminosity ratio is simply the flux ratio.
In Fig. 20 (top panel) we plot in green the distribution of log(CD) parameter for the Radio-Planck sample, which has a median value of 0.1. The median is only slightly larger than 0, implying that on average, the peak-power output for the sync and IC components are similar. In Fig. 20 (top panel), we add a tentative Gaussian fit to the log(CD) distributions, showing that a single Gaussian function (red dashed line) hardly describes the overall shape, particularly the highest CD values. The tail toward log(CD) > 1.0 probably owing to strong variability in γ-rays compared to radio bands, pushing log(CD) to high values. The mean value ⟨log(CD)⟩ = 0.17 ± 0.05 is clearly affected by that, therefore a median might be more reliable as the representation of steady γ-ray activity in LSP blazars.
The histograms at bottom panel of Fig. 20 represent the CD for different subsamples defined according to the 5BZcat classification, that is, BL Lacs, FSRQ, and unclassified sources. Nalewajko & Gupta (2017) have also estimated the CD for FSRQ and BL Lacs, but based on luminosities at fixed energies: L(1 GeV) as measured with Fermi-LAT, and L(3.4μm) as measured with the W1 channel from WISE satellite, for instance, CD = L(1 GeV)∕L(3.4μm). Our measurements instead are taken at the peak of Syn and IC components. In both cases, there is a trend for BL Lacs to populate the log(CD) range with the lowest values (with mean ⟨log(CD)(BL-Lac)⟩ = −0.16 ± 0.08), while FSRQ populate a wider region (with mean ⟨log(CD)(FSRQ)⟩ = 0.28 ± 0.06 for the Radio-Planck sample). We also checked whether the log(CD) distribution depends on radio flux density splitting the sample in two subsets withf5GHz > 1.5 Jy and ≤ 1.5 Jy, at 5 GHz. As result, the two histograms turned out to be very similar (a KS test gives a p-value = 0.693). Also a scatter plot of radio flux versus log(CD) shows no evidence of correlation between these quantities.
In Fig. 21, we plot the CD versus IC peak energy (EIC, in MeV). When considering the whole sample, there is no clear correlation between those parameters (the Pearson’s correlation coefficient r ≈ 0.13). However for individual classes (BL Lacs, FSRQ, and uncertain types) the BL Lacs tend to be associated with the highest IC peak energies, even though they are not dominating the end tail with high log (CD) values (Fig. 20, bottom panel).
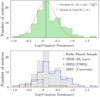 |
Fig. 20 Log(CD) distribution for the Radio-Planck sample. Top panel: the green bars represent all 99 cases that have Syn + IC data available for calculating the CD parameter. The red dashed line represents a Gaussian function with σ2 = 0.22 around the median value of log(CD) = 0.1. Bottom panel: the log(CD) distribution for BL Lacs (red dashed lines), FSRQ (blue dot-dashed lines), and blazars classified as uncertain are shown in green dashed lines. |
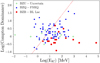 |
Fig. 21 Compton dominance vs. energy associated with the IC peak (EIC) for the Radio-Planck sample. We plot FSRQs as blue dots, BL Lacs as red dots, and uncertain blazars as green crosses. The red dotted line sets a qualitative cut to highlight the region populated by BL Lacs. |
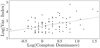 |
Fig. 22 γ-Ray variability index vs. log(CD) for the Radio-Planck sample. The dashed line represents a linear fit log(variability Index) = m × log(CD) + k, where the constants are m = 0.618 and k = 2.39. |
5.4 Influence of variability on the Compton dominance
According to Acero et al. (2015) the variability index indicates if a γ-ray source is variable on a timescale of months, not addressing shorter or longer time variations. An index >72.4 indicates a >99% confidence probability that the source is variable. At least ≈2/3 of the Radio-Planck sources (66 out of 104) have a variability index >72.4 therefore detected as variables on a timescale of months. To investigate if the variability index could be correlated to the CD, we plot in Fig. 22 the γ-ray log(Var. index) taken from the 3FGL catalog versus our estimate of the parameter log (CD). A linear fit of the scatter plot (Fig. 22) has a Pearson correlation coefficient of 0.40, meaning the positive correlation between log (Var. index) and log (CD) is relatively weak. In fact, this only tells us that the variability index might not be the best parameter to rely on if we are willing to investigate the influence of γ-ray variability over the CD parameter.
Lookingat individual cases however provides a better picture of CD variations induced by fast variability. We consider first the three sources detected in γ-rays only during flaring episodes (Sect. 4.5). These objects move from log(CD) <−1.0 (during γ-ray quiet period) up to 0.79, 0.31, and 2.51, respectively, for BZQJ 0010+1058, BZUJ 0241–0815, and BZQJ 2136+0041, and all cases show variability on timescales at least lower than one month (given that they are detected within isolated month bins), i.e., shorter than the monthly time bin described by the variability index parameter. Further studies are necessary to investigate the dependencies of transient and fast flares with respect to a time-bin smaller than that of a month, which we used.
Another example of strong γ-ray variability is BZQJ 1224+2122 (4C +21.35), whose SED is shown in Fig. 23. We fit both Syn and IC components with a third-order polynomial, listing fit parameters and their corresponding CD values in Table 4. We note that the high-energy peak flux changes by one order of magnitude in between 1FGL (dark blue) and 2FGL catalogs (red). This kind of long timescale variability (several months) is well represented by the variability index. When checking the light curve available online7 we see that this source had a relatively steady γ-ray emission during the first year of observations by Fermi-LAT (08/2008 to 08/2009, corresponding to the 1FGL SED; dark blue points), while it later underwent a strong activity when the photon flux varied by more than one order of magnitude in the 0.1–500 GeV band.
Since a more active state appears just after the integration time used for building the 1FGL catalog, we know that the flaring activity is now smoothed over two and four years of integration time. These integration times are used forthe 2FGL and 3FGL catalogs represented by red and light green points, respectively, in the high-energy SED. However, when integrating data only during the brightest state, it is possible to observe E > 100 GeV flux variability of ≈ one order of magnitude within hourly timescale, as for the flaring episode reported by Aleksić et al. (2011). This is a clear example of how the log(CD) parameter can vary widely, from −0.2 (during steady γ-ray emission) to +0.6 (when integrating over steady+flaring states), and reaching up to +1.3 (at the peak-flaring) as reported in Table 4.
Overall, these examples suggest that γ-ray flaring states are likely to generate the largest CD values in the tail of the distribution (Fig. 20, top panel). During flare episodes, the sources could be moving from a nearly steady multicomponent SSC + EC regime, to a short-lived EC-dominated regime, which produce large amplitude variability (up to three orders of magnitude) owing to the extra beaming factor ∝ δ1−α Dermer (1995) that is present in EC scenario. We will investigate that in a forthcoming paper.
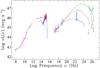 |
Fig. 23 SED for BZQJ 1224+2122, with blue bump template assuming z = 0.434. This source has the largest γ-ray variability index, and we fit the IC component during various flaring states. In the high-energy band, the blue line refers to the 1FGL detection (integrating 2008–2009 data), the red line refers to the 3FGL detection (2008–2012 data), and the dark-green line represents a short and relatively bright flare reported by the MAGIC team Aleksić et al. (2011) with reported variability within few hours. |
Inverse Compton peak parameters in various flaring states for 5BZQJ 1224+2122.
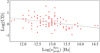 |
Fig. 24 Log(CD) vs. log( |


5.5 Compton dominance versus  plane
plane
Here we report on the relation between log(CD) and log( ) that has been argued in literature (Fossati et al. 1998; Potter & Cotter 2013; Nalewajko & Gupta 2017) to show a relatively strong correlation. In fact, for our sample the Pearson’s correlation coefficient r between log(CD) and log(
 ) is very weak, r ~−0.336, a direct consequence of the large scatter associated with these parameters. As shown in Fig. 24, we cover almost three decades in νpeak space, suggesting that the correlation between log(CD) and log(νpeak) parameters should be considered with great care in order to evaluate its dependence on selection effects when building the study sample.
It is also important to keep in mind that CD estimates reported for blazars with log(νpeak) > 15.0 are rather uncertain and subject to strong selection effects. It is extensively mentioned in literature (Acero et al. 2015; Ackermann et al. 2015b; Arsioli et al. 2015; Chang et al. 2017) that HSP blazars on average have a hard γ-ray spectral slope with ⟨Γ⟩ ranging from 1.8 to 2.0, and therefore the IC peak is most of the times out of reach for the Fermi-LAT, given its sensitivity window. For the brightest cases in which the IC peak was probed by VHE Cherenkov observatories, there is still the uncertainty introduced by absorption of VHE photons due to pair creation when scattering EBL photons. Indeed, onlya few HSP sources have their IC peak probed by VHE observatories with observations triggered by X-ray and γ-ray flaring states. This alone introduces a strong bias, given that no VHE blind sky survey is available.
6 Conclusions
The Radio-Planck sample includes 104 bright radio-selected sources (f > 1 Jy at 37 GHz), 102 of which are optically identified blazars in the 5BZcat and were expected to be detected by the Fermi-LAT. The two remaining objects are radio galaxies, namely 3C111 and M87, both detected in γ-rays. The noninclusion of a fair fraction of 5BZcat sources in published Fermi-LAT catalogs motivated our search for new γ-ray detections using 7.5 yr of data as available at the time of writing. The main results of our work can be summarized as follows. Out of 104 sources, 83 have counterparts from FGL catalogs (all TS > 25); 6 are new detections with TS > 20; 3 are new detections with TS in between 10 to 20; 3 are new associations with 3FGL sources (from improved positioning with high-energy TS maps); 1 is a new detection from solving γ-ray source-confusion; and 3 are transients that were detected during short flaring episodes.
Five sources remain undetected in the γ-ray band, all of which are optically identified blazars included in the 5BZcat. Two objects have relatively high redshift (5BZQJ 2139+1423 at z = 2.427 and 5BZQJ 2007+4029 at z = 1.736). The remaining three sources are 5BZQJ 0927+3902 (z = 0.695), 5BZQJ 2022+6136 (z = 0.228), 5BZQJ 1927+7358 (z = 0.302).
We conclude that most of sources currently called γ-ray quiet blazars are actually associated with relevant γ-ray signatures, becoming evident by means of a dedicated case-by-case study of 7.5 yr of Fermi-LAT observations. At most, γ-ray quiet blazars might be a very small fraction of the LSP population, suggesting there is no urgent need to introduce a new blazar class.From the five nondetections reported, two are high redshift sources, where absorption may hinder a γ-ray signature. Another case (5BZQJ 0927+3902) is associated with a bright 3FGL source that dominates the region, such that we could not probe for source confusion. Finally, 5BZQJ 2022+6136 and 5BZQJ 1927+7358 only showed hints of flaring activity and are probably under Fermi-LAT sensitivity.
All newdetections reported in this work contribute to solve a small fraction of the extragalactic γ-ray background into point-like sources. We note that the presence of transient sources, which are only detectable during short flaring episodes, could represent a non-negligible fraction of the MeV to GeV background. This would be a possible approach to consider in future studies. We discuss examples of how to extract refined and relevant γ-ray information by considering a multifrequency approach when searching for new sources, showing that Fermi-LAT database is a large resource still to be explored in detail.
We study the CD distribution, showing that a single Gaussian function fails to describe the cases with large log(CD) values at the tail of the histogram. There is indeed a number of high log(CD) sources that are in excess with respect to a single Gaussian fitting. We evaluate the impact of fast γ-ray variability on the CD parameter, considering 5BZQJ 1224+2122 as an example. We point out three cases in which large CD values are observed during fast flaring states (BZQJ 0010+1058, BZUJ 0241–0815, and BZQJ 2136+0041), such that CD values can be one to two orders of magnitude larger compared to those obtained during the steady and relatively faint γ-ray emission. As follows, the absent correlation between log(CD) versus log(Var. Index) in the scatter plot from Fig. 22 shows that the γ-ray variability index may not be the best tool to evaluate the relation connecting γ-ray flaring states and large log(CD) sources. Finally, we also evaluate the putative correlation between log(CD) and log( ) parameters, finding relatively weak evidence for that. The similarity between Syn and IC νfν peak distributions and the tight peak ratio log(
 /
/ ) distribution points to a dominant mechanism (either SSC or EC) to account for the IC component in bright LSP blazars, otherwise we would have found a large spread in the parameter space we probed. An extensive evaluation testing SSC and EC scenarios is explored with great detail in a parallel work (Arsioli & Chang 2018), which is based on the Radio-Planck sample.
Also, we showed a few examples for which the power-law fitting parameters estimated for faint γ-ray blazars, which were detected with TS between 10 and 25 under 3FGL setup integrating over 4.0 yr of Pass7 data, are later confirmed when integrating over a larger exposure time of 7.5 yr. This vindicates the importance and usefulness of reporting faint γ-ray signatures in association with blazar counterparts.
Acknowledgements
During this work, BA was supported by the Brazilian Scientific Program Ciências sem Fronteiras - Cnpq, and later by São Paulo Research Foundation (FAPESP) with grant n. 2017/00517-4. We would like to thank Prof. Paolo Giommi for his comments along the preparation of this work, Prof. Marcelo M. Guzzo and Prof. Orlando L. G. Peres for the full support which allowed the author partnership with FAPESP. We thanks IcraNet and Prof. Carlo Bianco for the cooperation granting access to Joshua Computer Cluster (Rome-Italy) for Fermi-LAT data reduction. We thank the CCJDR Data Center at IFGW Unicamp (Campinas-Brazil) where we also performed Fermi-LAT data reduction at their Feynman Cluster. We thank SSDC, Space Science Data Center from Agenzia Spaziale Italiana; University La Sapienza of Rome, Department of Physics; And State University of Campinas - Unicamp, IFGW Department of Physics for hosting the author. We make use of archival data and bibliographic information obtained from the NASA-IPAC Extragalactic Database (NED), data, and software facilities from the SSDC.
Appendix
Here we lits all 104 sources used for our studies.
References
- Abdo, A. A., Ackermann, M., Agudo, I., et al. 2010a, ApJ, 716, 30 [NASA ADS] [CrossRef] [Google Scholar]
- Abdo, A. A., Ackermann, M., Ajello, M., et al. 2010b, ApJS, 188, 405 [NASA ADS] [CrossRef] [Google Scholar]
- Acero, F., Donato, D., Ojha, R., et al. 2013, ApJ, 779, 133 [NASA ADS] [CrossRef] [Google Scholar]
- Acero, F., Ackermann, M., Ajello, M., et al. 2015, ApJS, 218, 23 [Google Scholar]
- Ackermann, M., Ajello, M., Allafort, A., Antolini, E., & Atwood, E. A. 2011, ApJ, 743, 171 [NASA ADS] [CrossRef] [Google Scholar]
- Ackermann, M., Ajello, M., Albert, A., et al. 2012, Phys. Rev. D, 85, 083007 [NASA ADS] [CrossRef] [Google Scholar]
- Ackermann, M., Ajello, M., Albert, A., et al. 2013, ApJ, 771, 57 [NASA ADS] [CrossRef] [Google Scholar]
- Ackermann, M., Ajello, M., Albert, A., et al. 2015a, ApJ, 799, 86 [NASA ADS] [CrossRef] [Google Scholar]
- Ackermann, M., Ajello, M., Atwood, W. B., & Baldini, E. A. 2015b, ApJ, 810, 14 [NASA ADS] [CrossRef] [Google Scholar]
- Ackermann, M., Ajello, M., Albert, A., et al. 2016a, Phys. Rev. Lett., 116, 151105 [NASA ADS] [CrossRef] [PubMed] [Google Scholar]
- Ackermann, M., Ajello, M., Atwood, W. B., et al. 2016b, ApJS, 222, 5 [NASA ADS] [CrossRef] [Google Scholar]
- Ajello, M., Atwood, W. B., Baldini, L., et al. 2017, ApJS, 232, 18 [NASA ADS] [CrossRef] [Google Scholar]
- Aleksić, J., Antonelli, L. A., Antoranz, P., et al. 2011, ApJ, 730, L8 [NASA ADS] [CrossRef] [Google Scholar]
- Ando, S., Benoit-Lévy, A., & Komatsu, E. 2014, Phys. Rev. D, 90, 023514 [NASA ADS] [CrossRef] [Google Scholar]
- Angelakis, E., Hovatta, T., Blinov, D., et al. 2016, MNRAS, 463, 3365 [NASA ADS] [CrossRef] [Google Scholar]
- Arsioli, B., & Chang, Y.-L. 2017, A&A, 598, A134 [NASA ADS] [CrossRef] [EDP Sciences] [Google Scholar]
- Arsioli, B., & Chang, Y.-L. 2018, A&A, in press, DOI: 10.1051/0004-6361/201833005 [Google Scholar]
- Arsioli, B., Fraga, B., Giommi, P., Padovani, P., & Marrese, P. M. 2015, A&A, 579, A34 [NASA ADS] [CrossRef] [EDP Sciences] [Google Scholar]
- Atwood, W. B., Abdo, A. A., Ackermann, M., et al. 2009, ApJ, 697, 1071 [NASA ADS] [CrossRef] [Google Scholar]
- Atwood, W., Albert, A., Baldini, L., et al. 2013, ArXiv e-prints [arXiv:1303.3514] (Fermi Symposium Proceedings - eConf C121028) [Google Scholar]
- Blinov, D., Pavlidou, V., Papadakis, I., et al. 2015, MNRAS, 453, 1669 [NASA ADS] [CrossRef] [Google Scholar]
- Chang, Y.-L., Arsioli, B., Giommi, P., & Padovani, P. 2017, A&A, 598, A17 [NASA ADS] [CrossRef] [EDP Sciences] [Google Scholar]
- Condon, J. J., Cotton, W. D., Greisen, E. W., et al. 1998, AJ, 115, 1693 [NASA ADS] [CrossRef] [Google Scholar]
- Cuoco, A., Komatsu, E., & Siegal-Gaskins, J. M. 2012, Phys. Rev. D, 86, 063004 [NASA ADS] [CrossRef] [Google Scholar]
- De Angelis, A., Tatischeff, V., Grenier, I. A., et al. 2017, ArXiv e-prints [arXiv:1711.01265] [Google Scholar]
- Dermer, C. D. 1995, ApJ, 446, L63 [NASA ADS] [CrossRef] [Google Scholar]
- Di Mauro, M., & Donato, F. 2015, Phys. Rev. D, 91, 123001 [NASA ADS] [CrossRef] [Google Scholar]
- Di Mauro, M., Donato, F., Lamanna, G., Sanchez, D. A., & Serpico, P. D. 2014, ApJ, 786, 129 [NASA ADS] [CrossRef] [Google Scholar]
- Finke, J. D. 2013, ApJ, 763, 134 [NASA ADS] [CrossRef] [Google Scholar]
- Fornasa, M., & Sánchez-Conde, M. A. 2015, Phys. Rep., 598, 1 [NASA ADS] [CrossRef] [Google Scholar]
- Fossati, G., Maraschi, L., Celotti, A., Comastri, A., & Ghisellini, G. 1998, MNRAS, 299, 433 [NASA ADS] [CrossRef] [Google Scholar]
- Franceschini, A., Rodighiero, G., & Vaccari, M. 2008, A&A, 487, 837 [NASA ADS] [CrossRef] [EDP Sciences] [Google Scholar]
- Giommi, P., Padovani, P., Polenta, G., et al. 2012a, MNRAS, 420, 2899 [NASA ADS] [CrossRef] [Google Scholar]
- Giommi, P., Polenta, G., Lähteenmäki, A., et al. 2012b, A&A, 541, A160 [NASA ADS] [CrossRef] [EDP Sciences] [Google Scholar]
- Gregory, P. C., Scott, W. K., Douglas, K., & Condon, J. J. 1996, ApJS, 103, 427 [NASA ADS] [CrossRef] [Google Scholar]
- Grupe, D., Komossa, S., Leighly, K. M., & Page, K. L. 2010, ApJS, 187, 64 [NASA ADS] [CrossRef] [Google Scholar]
- Inoue, Y. 2014, Fifth Fermi Symp. Proc. (Nagoya: Japan) [Google Scholar]
- Lister, M. L., Homan, D. C., Kadler, M., et al. 2009, ApJ, 696, L22 [NASA ADS] [CrossRef] [Google Scholar]
- Lister, M. L., Aller, M. F., Aller, H. D., et al. 2015, ApJ, 810, L9 [NASA ADS] [CrossRef] [Google Scholar]
- MacDonald, N. R., Jorstad, S. G., & Marscher, A. P. 2017, ApJ, 850, 87 [NASA ADS] [CrossRef] [Google Scholar]
- Massaro, E., Maselli, A., Leto, C., et al. 2015, Astrophys. Space Sci., 357, 75 [Google Scholar]
- Mattox, J. R., Bertsch, D. L., Chiang, J., et al. 1996, ApJ, 461, 396 [NASA ADS] [CrossRef] [Google Scholar]
- Meyer, E. T., Fossati, G., Georganopoulos, M., & Lister, M. L. 2012, ApJ, 752, L4 [NASA ADS] [CrossRef] [Google Scholar]
- Nalewajko, K., & Gupta, M. 2017, A&A, 606, A44 [NASA ADS] [CrossRef] [EDP Sciences] [Google Scholar]
- Padovani, P., & Giommi, P. 1995, ApJ, 444, 567 [NASA ADS] [CrossRef] [Google Scholar]
- Padovani, P., Alexander, D. M., Assef, R. J., et al. 2017, A&ARv, 25, 2 [Google Scholar]
- Paliya, V. S., Marcotulli, L., Ajello, M., et al. 2017, ApJ, 851, 33 [NASA ADS] [CrossRef] [Google Scholar]
- Planck Collaboration XV. 2011, A&A, 536, A15 [NASA ADS] [CrossRef] [EDP Sciences] [Google Scholar]
- Potter, W. J. 2018, MNRAS, 473, 4107 [NASA ADS] [CrossRef] [Google Scholar]
- Potter, W. J.,& Cotter, G. 2013, MNRAS, 431, 1840 [NASA ADS] [CrossRef] [Google Scholar]
- Prokhorov, D. A., & Churazov, E. M. 2014, A&A, 567, A93 [NASA ADS] [CrossRef] [EDP Sciences] [Google Scholar]
- Tatischeff, V., Tavani, M., von Ballmoos, P., et al. 2016, in Space Telescopes and Instrumentation 2016: Ultraviolet to Gamma Ray, Proc. SPIE, 9905, 99052N [Google Scholar]
- Vanden Berk, D. E., Richards, G. T., Bauer, A., et al. 2001, AJ, 122, 549 [NASA ADS] [CrossRef] [Google Scholar]
In this regard, we are following recommendations from Fermi Science Tools user guide https://fermi.gsfc.nasa.gov/ssc/data/analysis/scitools/binned_likelihood_tutorial.html, which recommends setting free parameters at least within 7° from the source of interest. This is a consequence of the large point spread function (PSF), especially at low-energy threshold, which can overlap with nearby sources. Therefore, in order to get a confident description of a particular source, we properly fit and adjust the whole environment around it.
3FGL sensitivity considering the instrument response function (P7REP-SOURCE-V15), as described at Fermi-LAT repository http://www.slac.stanford.edu/exp/glast/groups/canda/archive/p7rep_v15/lat_Performance.htm
For a complete description of the Fermi Science Tools, see https://fermi.gsfc.nasa.gov/ssc/data/analysis
For a description on the Fermi-LAT performance, see https://www.slac.stanford.edu/exp/glast/groups/canda/lat_Performance.htm

Light curve for BZQJ 1224+2122 (3FGLJ 1224.9+2122): http://fermi.gsfc.nasa.gov/ssc/data/access/lat/4yr_catalog/ap_lcs/lightcurve_3FGLJ1224.9p2122.png
All Tables
Source model parameters derived from the Fermi Science Tools assuming a power-law to describe the γ-ray spectrum within the 0.1–500 GeV energy band, with N0 given in ph cm−2 s−1 MeV−1, and assumingE0 = 1000 MeV.
Source model parameters from Fermi Science Tools, assuming a power-law to describe the γ-ray spectrum within 0.1–500 GeV, with N0 given in [ph cm−2 s−1 MeV−1], and using E0 = 1000 MeV as pivotenergy.
All Figures
|
Fig. 1 5BZQJ 0359+5057. Top left panel: TS map considering only E > 0.5 GeV photons with black dashed lines representing 68%, 95%, and 99% containment regions for the γ-ray signature (used for all further TS maps), considering the brightest period from 2014 to 2015; 5BZQJ 0359+5057 is marked with a circle centered at “+”. Top right panel: the SED with a polynomial fit to the mean Syn and IC components; the blue-bump feature between 1014 and 1018 Hz (Vanden Berk et al. 2001) for a source at z = 1.512. In the γ-ray band, red points represent the SED before flaring (before 2013), while blue is for the flaring period (after 2013). Bottom panel: 0.3–500 GeV light curve along 7.5 yr of observations with bins of 30 days; red points represent upper limit flux. |
| In the text | |
|
Fig. 2 BZQJ 1955+5131. Top left panel: TS map considering only E > 0.5 GeV photons, during the high-state period between 2014 and 2015. Top right panel: SED for 5BZQJ 1955+5131 at z = 1.21, with the newγ-ray spectrum in the 0.3–500 GeV band. As example, in the 1022 –1026 Hz band (0.1–500 GeV), we show the Fermi-LAT sensitivity limit when integrating over four year of observations. Bottom panel: the γ-ray light curve for 5BZQJ 1955+5131 along 7.5 yr of observations and with time bin of 30 days. |
| In the text | |
|
Fig. 3 5BZUJ 0909+4253. Top left panel: TS map considering only E > 0.5 GeV photons during the brightest period, from January 6 to February 6, 2009. Top right panel: SED for 5BZUJ 0909+4253, z = 0.670. Bottom panel: the γ-ray light curve along 7.5 yr of observations. |
| In the text | |
|
Fig. 4 5BZQJ 1153+8058. Top left panel: TS map using E > 3.0 GeV photons collected during the 2014 flaring period. Top right panel: SED for 5BZQJ 1153+8058 also showing the template for thermal emission from accretion in the range 1014 –1018 Hz assuming z = 1.250. Bottom panel: the γ-ray light curve for 5BZQJ 1153+8058 along 7.5 yr. |
| In the text | |
|
Fig. 5 5BZQJ 0646+4451. Left panel: TS map considering 500 MeV to 12 GeV photons and integrating over the flaring period from October 25 to November 30, 2010. Black dashed lines represent 68% and 95% confinement regions for the γ-ray signature. Right panel: SED for 5BZQJ 0646+4451, also showing the blue bump template assuming z = 3.396. |
| In the text | |
|
Fig. 6 5BZQJ 0125–0005. Left panel: TS map considering only E > 500 MeV photons and integrating data along the brightest month from July 31 to August 31, 2013. Black dashed lines show the 68% and 95% confinement region for the γ-ray signatures. Right panel: multifrequency SED for 5BZQJ 1153+8058 with the blue bump template corresponding to z = 1.077. |
| In the text | |
|
Fig. 7 BZQJ 1642+6856. Top left panel: TS map for E > 1.0 GeV. The green thin lines show contours corresponding to TS values of 15, 12, 8, and black dashed lines represent 68%, 95%, and 99% containment region. Top right panel: residual TS map for E > 1 GeV considering a source placed at the 2WHSP position, indicated with green cross, as part of the γ-ray background; in this case the black dashed line corresponds to the 68% confinement radius for the γ-ray source, while the white cross indicates the position of BZQJ 1642+6856. Middle and bottom panels: SEDs for 2WHSPJ 1640+6852 for which no optical identification is available yet, and BZQJ 1642+6856 with z = 0.751. The upper limits on the γ-ray spectra have been calculated only for energy bins with low significance. |
| In the text | |
|
Fig. 8 5BZUJ 0433+0521. Top left panel: TS map built using only photons with E > 2.0 GeV; Black dashed lines show 68%, 95%, and 99% confinement regions. The position of a nearby BZU source is highlighted by the green circle around the “+” marker, while 3FGL detection is center on the magenta dashed circle. Top right panel: an image obtained from the SSDC Sky-Explorer showing that 5BZUJ 0433+0521 position is inconsistent with 3FGLJ 0432.5+0539 detection also taking into account its 95% positional uncertainty (dot-dahsed ellipse). Blue and red circles represent respectively X-ray and radio frequency detections in the same region as taken from publicly available data. Bottom panel: SED for 5BZUJ 0433+0521 with blue bump template for z = 0.033. |
| In the text | |
|
Fig. 9 5BZQJ 0555+3948. Top right panel: Sky-Explorer view, showing 3FGLJ 0556.2+3933 indicated as a red cross, while 5BZQJ 0555+3948 is outside the error circle associated with the γ-ray signature from 3FGL database. Blue and red circles represent X-ray and radio detections in this region. Top left panel: TS map, E > 1.0 GeV with improved position for the γ-ray signature; Black dashed lines show the 68%, 95%, and 99% confinement region for the γ-ray signatures. The dashed magenta circle corresponds to the 3FGLJ 0556.2+3933 position, while the green circle is centered on the position of 5BZQJ 0555+3948 marked as black cross. Bottom panel: SED for 5BZQJ 0555+3948, where the blue bump template assumes z = 2.365. |
| In the text | |
|
Fig. 10 5BZQJ 0228+6721. Top left panel: Sky-Explorer view, showing 3FGLJ 0228.5+6703 marked with “x” symbol, and dashed line for the error circle associated with the 3FGL γ-ray signature. We also highlight the positions of GB6 J0229+6706 and 5BZQJ 0228+6721. The red and blue circles represent radio and X-ray detections in the field. Top right panel: TS map considering E > 500 MeV photons, with dashed lines representing 68%, 95%, and 99% containment region for the γ-ray signature; 5BZQJ 0228+6721 is center at “+” matching the TS peak position. Bottom panel: SED for 5BZQJ 0228+6721, with blue bump assuming z = 0.523. |
| In the text | |
|
Fig. 11 TS maps for the low-significance γ-ray detections using only E > 500 MeV photons. For each case the blazar position is highlighted with thick green circle center at “+”. Black dashed lines show the 50%, 68%, and 95% containment radius for the γ-ray signature. |
| In the text | |
|
Fig. 12 5BZQJ0010+1058. Top left panel: TS map considering E > 500 MeV photons during a short-flare episode at MET: 296164808–298860398. Black dashed lines representing 68% and 95% containmentregion for the γ-ray signature. Top right panel: the corresponding SED of this object. Bottom panel: light curve for 5BZQJ 0010+1058 background extracted with likelihood analysis; flux points are calculated only for bins having TS > 4 with a 30 day time bin along 7.5 yr of observations, integrating 0.3–500 GeV photons. |
| In the text | |
|
Fig. 13 5BZUJ 0241–0815. Top left panel: TS map for E > 500 MeV during a short-flare episode at MET: 415846402-418598890. The blazar position is highlighted by the green circle center at “+”; the black dashed-lines are TS surfaces corresponding 68%, 95%, and 99% confinement region for the γ-ray signature. Top right panel: the corresponding SED of this object; the green template corresponds to the elliptical galaxy emission at z = 0.005. Bottom panel: light curve for 5BZU J0241–0815. Flux points are only calculated for bins with TS > 5 with a 30 day time bin along 7.5 yr of observations, integrating 0.3–500 GeV photons. |
| In the text | |
|
Fig. 14 5BZQJ 2136+0041. Top left panel: TS map for E > 300MeV during a short-flare episode at MET: 410341424 413093913. The blazar position is highlighted by a green circle withcenter at “+”. The black dashed lines correspond to 50% and 68% confinement radius for the γ-ray signature. Top right panel: the corresponding SED of this object; the blue bump template assumes z = 1.941. Bottom panel: light curve for 5BZQJ2136+0041, flux is calculated only for TS > 5 bins, with a 30 day time bin along 7.5 yr of observations, integrating 0.3–500 GeV photons. |
| In the text | |
|
Fig. 15 5BZQJ 0927+3902. Left panel: TS map for 750–950 MeV photons. The blazar 5BZQJ 0927+3902 is highlighted as a green circle and 3FGL is shown in magenta. Right panel: the SED with a polynomial fit to the mean Syn and the blue-bump template are represented for z = 0.695. In the γ-ray band, the blue curve in the 1022–1026Hz band (0.1–500 GeV) represents the Fermi-LAT four year sensitivity threshold, therefore an upper limit for the γ-ray emission. |
| In the text | |
|
Fig. 16 Distribution of log( |
| In the text | |
|
Fig. 17 Histogram of log(νfν) at the Syn peak (in red) and the IC peak (in blue), considering all 99 sources in the Radio-Planck sample for which we could estimate the Syn and IC peak parameters. |
| In the text | |
|
Fig. 18 Peak ratio log( |
| In the text | |
|
Fig. 19 Top panel: distribution of log( |
| In the text | |
|
Fig. 20 Log(CD) distribution for the Radio-Planck sample. Top panel: the green bars represent all 99 cases that have Syn + IC data available for calculating the CD parameter. The red dashed line represents a Gaussian function with σ2 = 0.22 around the median value of log(CD) = 0.1. Bottom panel: the log(CD) distribution for BL Lacs (red dashed lines), FSRQ (blue dot-dashed lines), and blazars classified as uncertain are shown in green dashed lines. |
| In the text | |
|
Fig. 21 Compton dominance vs. energy associated with the IC peak (EIC) for the Radio-Planck sample. We plot FSRQs as blue dots, BL Lacs as red dots, and uncertain blazars as green crosses. The red dotted line sets a qualitative cut to highlight the region populated by BL Lacs. |
| In the text | |
|
Fig. 22 γ-Ray variability index vs. log(CD) for the Radio-Planck sample. The dashed line represents a linear fit log(variability Index) = m × log(CD) + k, where the constants are m = 0.618 and k = 2.39. |
| In the text | |
|
Fig. 23 SED for BZQJ 1224+2122, with blue bump template assuming z = 0.434. This source has the largest γ-ray variability index, and we fit the IC component during various flaring states. In the high-energy band, the blue line refers to the 1FGL detection (integrating 2008–2009 data), the red line refers to the 3FGL detection (2008–2012 data), and the dark-green line represents a short and relatively bright flare reported by the MAGIC team Aleksić et al. (2011) with reported variability within few hours. |
| In the text | |
|
Fig. 24 Log(CD) vs. log( |
| In the text | |
Current usage metrics show cumulative count of Article Views (full-text article views including HTML views, PDF and ePub downloads, according to the available data) and Abstracts Views on Vision4Press platform.
Data correspond to usage on the plateform after 2015. The current usage metrics is available 48-96 hours after online publication and is updated daily on week days.
Initial download of the metrics may take a while.