Fig. 6
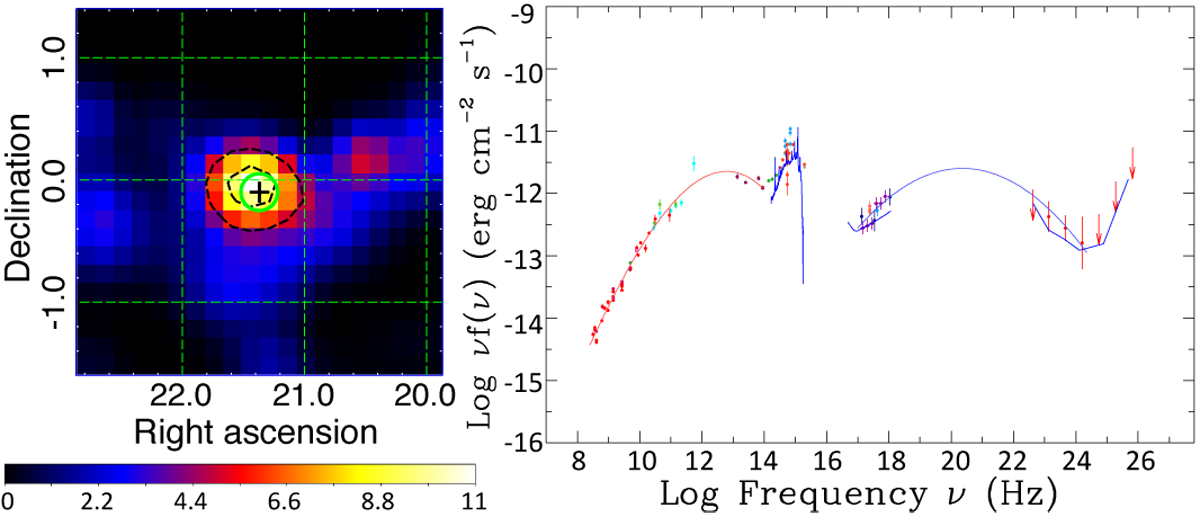
5BZQJ 0125–0005. Left panel: TS map considering only E > 500 MeV photons and integrating data along the brightest month from July 31 to August 31, 2013. Black dashed lines show the 68% and 95% confinement region for the γ-ray signatures. Right panel: multifrequency SED for 5BZQJ 1153+8058 with the blue bump template corresponding to z = 1.077.
Current usage metrics show cumulative count of Article Views (full-text article views including HTML views, PDF and ePub downloads, according to the available data) and Abstracts Views on Vision4Press platform.
Data correspond to usage on the plateform after 2015. The current usage metrics is available 48-96 hours after online publication and is updated daily on week days.
Initial download of the metrics may take a while.