Fig. 5
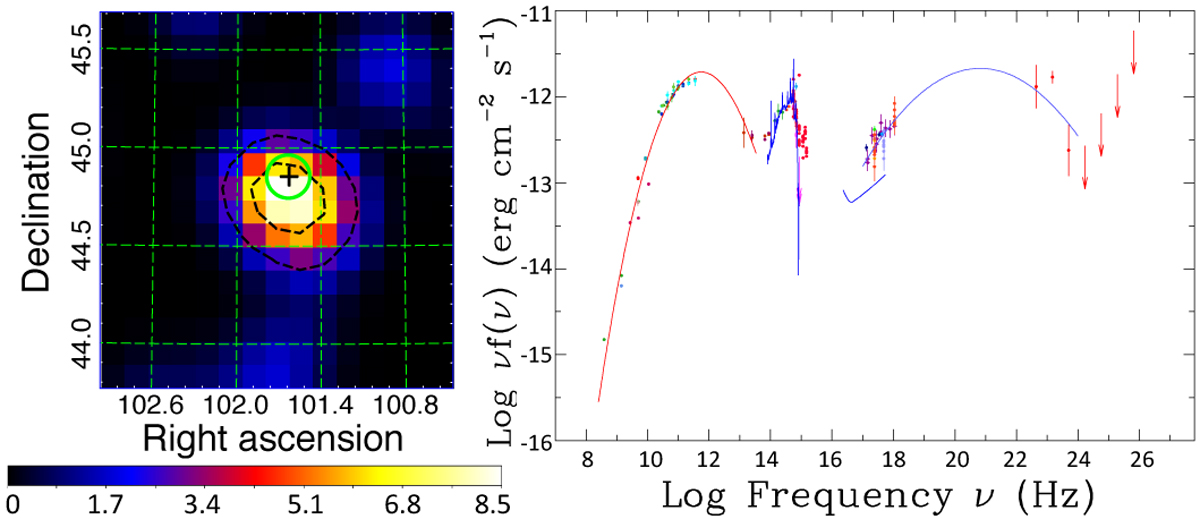
5BZQJ 0646+4451. Left panel: TS map considering 500 MeV to 12 GeV photons and integrating over the flaring period from October 25 to November 30, 2010. Black dashed lines represent 68% and 95% confinement regions for the γ-ray signature. Right panel: SED for 5BZQJ 0646+4451, also showing the blue bump template assuming z = 3.396.
Current usage metrics show cumulative count of Article Views (full-text article views including HTML views, PDF and ePub downloads, according to the available data) and Abstracts Views on Vision4Press platform.
Data correspond to usage on the plateform after 2015. The current usage metrics is available 48-96 hours after online publication and is updated daily on week days.
Initial download of the metrics may take a while.