Fig. 7
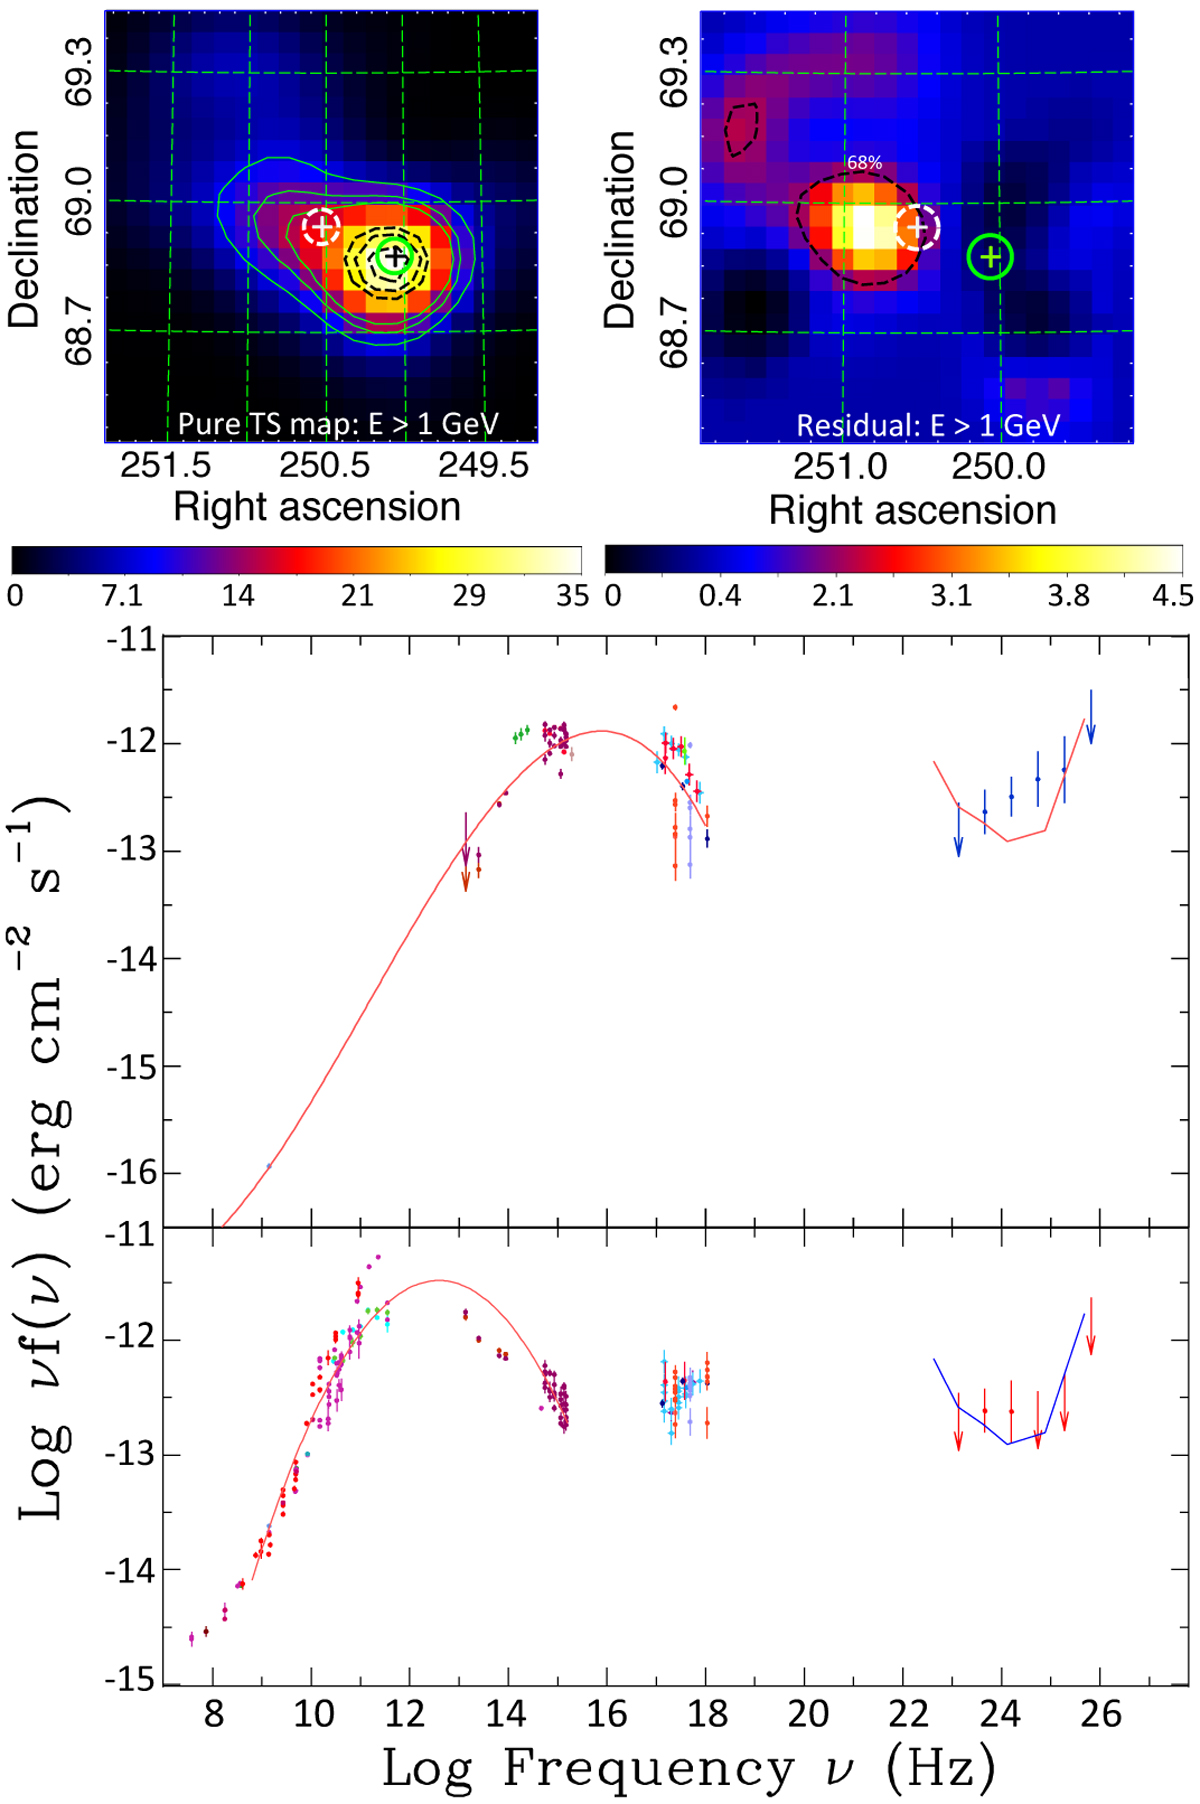
BZQJ 1642+6856. Top left panel: TS map for E > 1.0 GeV. The green thin lines show contours corresponding to TS values of 15, 12, 8, and black dashed lines represent 68%, 95%, and 99% containment region. Top right panel: residual TS map for E > 1 GeV considering a source placed at the 2WHSP position, indicated with green cross, as part of the γ-ray background; in this case the black dashed line corresponds to the 68% confinement radius for the γ-ray source, while the white cross indicates the position of BZQJ 1642+6856. Middle and bottom panels: SEDs for 2WHSPJ 1640+6852 for which no optical identification is available yet, and BZQJ 1642+6856 with z = 0.751. The upper limits on the γ-ray spectra have been calculated only for energy bins with low significance.
Current usage metrics show cumulative count of Article Views (full-text article views including HTML views, PDF and ePub downloads, according to the available data) and Abstracts Views on Vision4Press platform.
Data correspond to usage on the plateform after 2015. The current usage metrics is available 48-96 hours after online publication and is updated daily on week days.
Initial download of the metrics may take a while.