Free Access
Fig. 18
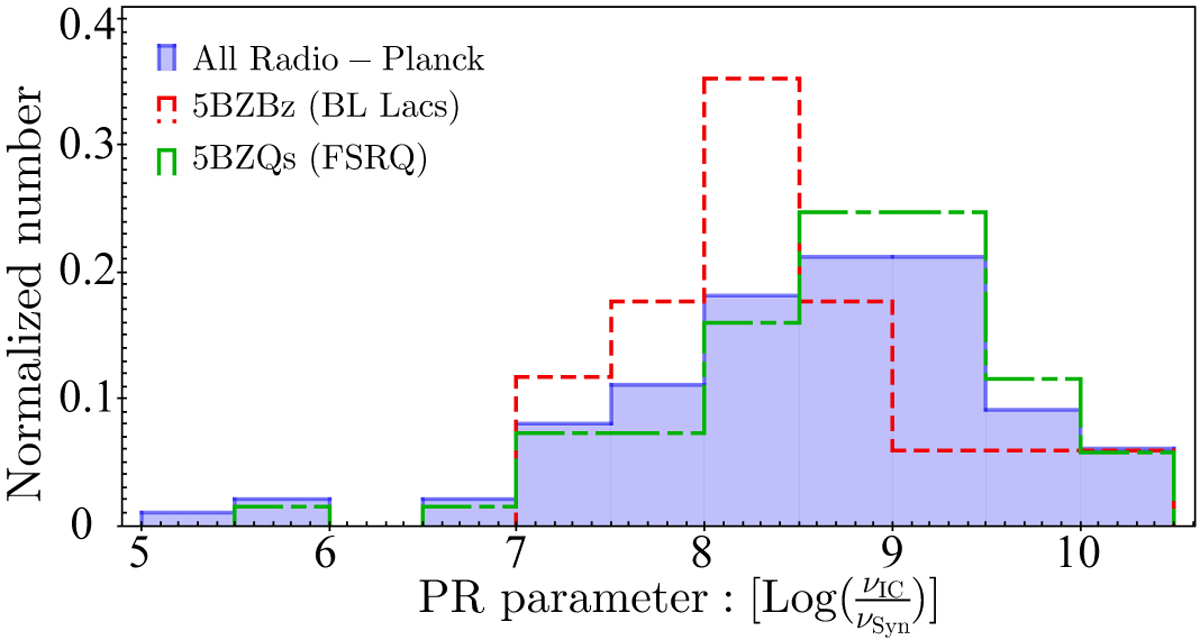
Peak ratio log(![]() ) distribution.Full indigo bars represent the whole Radio-Planck sample, red dashed bars indicated the subsample of BL Lacs, and green dot-dashed bars show the subsample of FSRQ.
) distribution.Full indigo bars represent the whole Radio-Planck sample, red dashed bars indicated the subsample of BL Lacs, and green dot-dashed bars show the subsample of FSRQ.
Current usage metrics show cumulative count of Article Views (full-text article views including HTML views, PDF and ePub downloads, according to the available data) and Abstracts Views on Vision4Press platform.
Data correspond to usage on the plateform after 2015. The current usage metrics is available 48-96 hours after online publication and is updated daily on week days.
Initial download of the metrics may take a while.