Fig. 1
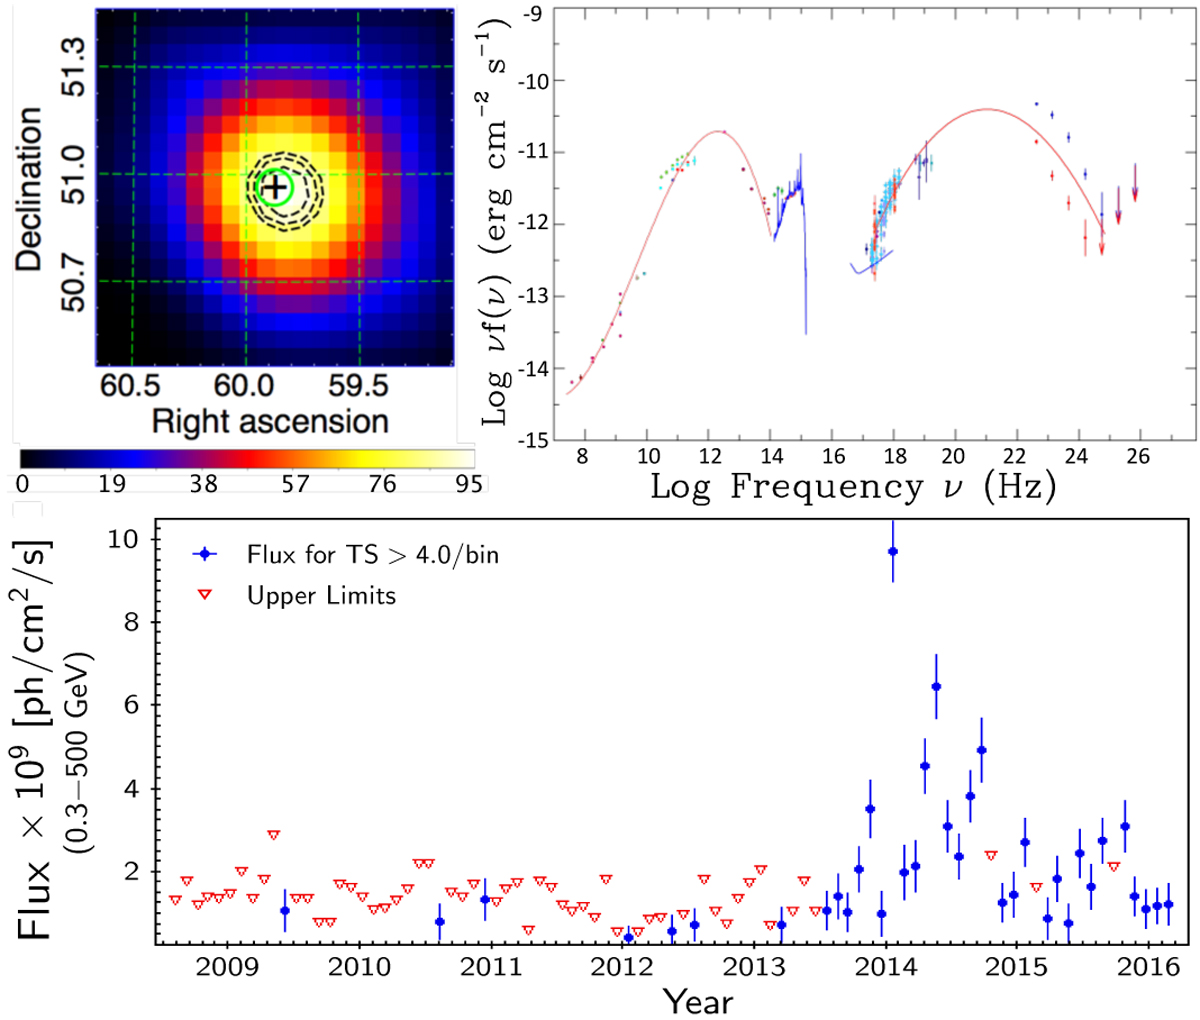
5BZQJ 0359+5057. Top left panel: TS map considering only E > 0.5 GeV photons with black dashed lines representing 68%, 95%, and 99% containment regions for the γ-ray signature (used for all further TS maps), considering the brightest period from 2014 to 2015; 5BZQJ 0359+5057 is marked with a circle centered at “+”. Top right panel: the SED with a polynomial fit to the mean Syn and IC components; the blue-bump feature between 1014 and 1018 Hz (Vanden Berk et al. 2001) for a source at z = 1.512. In the γ-ray band, red points represent the SED before flaring (before 2013), while blue is for the flaring period (after 2013). Bottom panel: 0.3–500 GeV light curve along 7.5 yr of observations with bins of 30 days; red points represent upper limit flux.
Current usage metrics show cumulative count of Article Views (full-text article views including HTML views, PDF and ePub downloads, according to the available data) and Abstracts Views on Vision4Press platform.
Data correspond to usage on the plateform after 2015. The current usage metrics is available 48-96 hours after online publication and is updated daily on week days.
Initial download of the metrics may take a while.